Mortgage Calculator for High Net Worth: Complete 2026 Guide
By Tyler Singletary · · Updated · in Decision frameworks
Most mortgage calculators are built for a buyer profile that no longer matches the high net worth market. They assume W-2 income, a single-loan structure, the full mortgage-interest deduction, and a down payment funded from cash. For a buyer with a $3M portfolio, two RSU vesting tranches a year, a multi-state tax footprint, and the option to fund the purchase from a pledged asset line instead of liquidating taxable holdings, the standard Bankrate or Zillow calculator misses the parts of the math that matter most. The headline payment is the easy number. The hard numbers, after-tax effective rate, opportunity cost on the down payment, asset-depletion qualifying income, the marginal value of the deduction under the $750K cap, are the ones that change the decision.
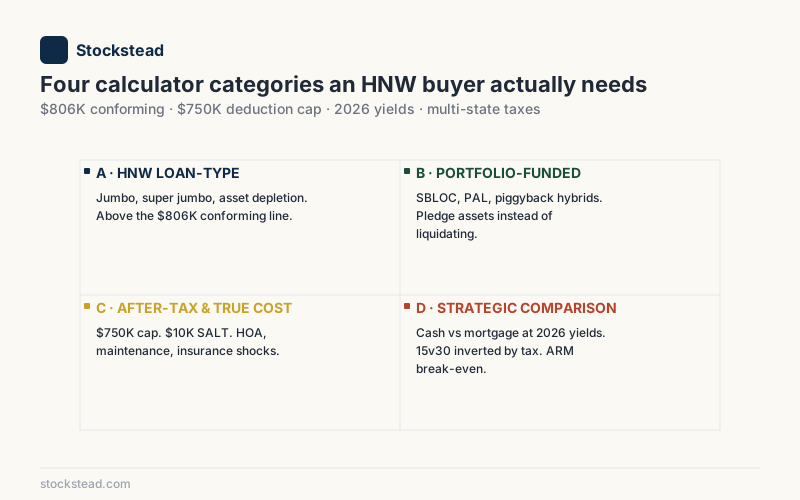
This guide is the index for the calculators an HNW buyer actually needs in 2026. It introduces four calculator categories, points to the spoke posts for each, and walks through the specific failure modes of generic tools at high incomes and large loan sizes. For the broader decision framework on financing structures, see our complete guide to high net worth home buyer financing.
Market rates on this page are as of October 8, 2026; loan limits are the 2026 FHFA figures. Worked examples use a 7.39% jumbo rate, the MBA average for the week of Oct 2, 2026. Conforming loan limits update annually each November. The Freddie Mac PMMS 30-year average and SOFR move daily. Verify any rate or limit directly with primary sources (linked at the bottom) before sizing a loan or running a comparison.
Why generic mortgage calculators fail HNW buyers
As of October 8, 2026, the average 30-year fixed mortgage rate was 7.40% per Freddie Mac's Primary Mortgage Market Survey (the MBA 30-year jumbo average was 7.39%), and the 2026 baseline conforming loan limit sits at $832,750 per the Federal Housing Finance Agency's November 2025 announcement. Generic calculators treat both numbers as the whole story. For an HNW buyer purchasing above the conforming limit with non-W-2 income components and a multi-state tax footprint, three structural assumptions inside the standard calculator quietly break.
Assumption one: income is W-2 and DTI-qualifying is mechanical. The standard calculator either asks for monthly income or backs into a maximum loan size from a DTI ratio. Neither approach handles the typical HNW income mix: base salary, RSU vests at irregular intervals, partnership distributions, K-1 income, deferred compensation, or rental income. Jumbo underwriters apply lender-specific rules to each of these. A two-year average of RSU vests counts at most lenders, but only if the vesting continues. A K-1 distribution counts if the entity has positive retained earnings. A generic calculator's "monthly income" field collapses all of that into a single number and produces an answer that any jumbo loan officer will revise downward at intake.
Assumption two: the mortgage interest deduction covers the whole loan. It does not. Per IRS Publication 936, post-2017 mortgages cap deductible acquisition indebtedness at $750,000 (the cap was $1M before the 2017 Tax Cuts and Jobs Act, and the One Big Beautiful Bill Act made the $750K level permanent). On a $2.4M jumbo at 7.39% (the MBA jumbo average for the week of Oct 2, 2026), the deductible portion of year-one interest is roughly $55,400; the non-deductible portion above the cap is roughly $121,200. The headline "tax savings" line on a generic calculator typically assumes the entire interest payment is deductible at the buyer's marginal rate. That single error overstates the after-tax benefit by 60-70% for most HNW buyers above the cap.
Assumption three: the down payment is free cash. For a buyer funding a $500K down payment from a taxable brokerage account with a 50% cost basis, the real cost of that down payment includes a capital gains tax bill of roughly $70K ($250K gain at 28% combined LTCG plus NIIT plus state) plus the forgone compounding on the withdrawn capital. Over a ten-year hold at a 7% expected real return, the opportunity cost of liquidating $500K of taxable investments compounds to roughly $480K. The generic calculator's payment field is the same whether the down payment came from cash savings, a portfolio liquidation, or a portfolio-secured loan. The buyer's actual cost varies by hundreds of thousands of dollars across those three sources.
The fix is not a better single calculator. It is a stack of four calculator categories, each tuned to a part of the HNW math that the generic tool ignores. The next section introduces them.
What four calculator categories does an HNW buyer actually need?
For a buyer above the conforming limit, the operative question is not "what is my monthly payment" but "what is the lowest after-tax effective rate I can achieve across all available financing structures." That requires four distinct calculator categories working together.
Category A: HNW loan-type calculators. Jumbo, super jumbo (above $1.25M), and asset depletion. These handle the qualification and base-pricing math that generic conforming calculators cannot. The threshold is the FHFA's 2026 baseline of $832,750 (or the high-cost ceiling of $1,249,125 in designated counties). Above that line, underwriting standards, reserve requirements, and pricing all shift, and the calculator needs to know which jumbo tier applies.
Category B: Portfolio-funded calculators. SBLOC, PAL, and piggyback hybrids. These model the carry cost of using pledged investment assets instead of cash to fund the down payment or the purchase itself. For an HNW buyer with a substantial taxable brokerage account, this category is where the structurally different decision lives. Every other category is variations on the conventional mortgage path.
Category C: After-tax and true-cost calculators. These convert the headline rate to an after-tax effective rate, apply the $750K acquisition-indebtedness cap, account for the SALT cap ($40,400 for 2026, phasing down to $10,000 at high incomes), and add the line items that PITI omits: HOA, maintenance reserve, insurance shocks in catastrophe markets, and capital improvements over a typical hold period. Total cost of ownership on a $3M home runs 15-30% above what the PITI line shows.
Category D: Strategic comparison calculators. Cash vs mortgage at current opportunity-cost yields. Fifteen-year vs thirty-year amortization with HNW tax-bracket math. ARM vs fixed jumbo with break-even analysis on the reset risk. These are decision-support tools that compare two financing paths side by side, not single-payment calculators.
The pillar of the cluster is that no single one of these four answers the question on its own. The buyer who runs only the jumbo PITI calculator overpays on the structure decision. The buyer who runs only the after-tax calculator misjudges qualification. The buyer who runs only the SBLOC calculator misses the deductible-portion advantage of the conventional jumbo. The honest answer is that a HNW financing decision requires running all four categories and reconciling the outputs. The spokes of this cluster build each calculator out in detail; the sections below introduce them.
HNW loan-type calculators: jumbo, super jumbo, asset depletion
Per the Federal Housing Finance Agency, the 2026 baseline conforming loan limit for a one-unit property is $832,750, with a high-cost ceiling of $1,249,125 in designated counties. Any loan above the applicable county limit is a jumbo, underwritten outside Fannie Mae and Freddie Mac standards. For HNW buyers, three loan-type calculators do most of the work in this category: jumbo, super jumbo, and asset depletion.
Jumbo PITI calculators
A jumbo PITI calculator differs from a conforming calculator in three ways. First, it allows loan sizes above $832,750 without throwing a "loan size exceeds limit" error. Second, it accepts the higher reserve requirements (typically 6-18 months of PITI in liquid reserves, vs the 2 months for a conforming loan). Third, it applies a slightly different rate, jumbo rates historically run within 25-50 basis points of conforming on either side, depending on the lender's portfolio appetite at the moment. For the full math, see the jumbo mortgage calculator spoke.
For the decision-framework view of when a jumbo wins versus an all-cash purchase or a portfolio-secured alternative, the existing essay on jumbo mortgages for HNW buyers and when the bank wins is the companion piece to the calculator spoke.
Super jumbo calculators
Above roughly $1.25M-$2M (the exact threshold varies by lender), the loan enters super jumbo territory. The pricing tier shifts again, often unfavorably: reserve requirements climb to 12-24 months of PITI, the lender's appetite narrows to private-bank channels, and DTI standards tighten. A super jumbo calculator handles these threshold effects natively. For loans above roughly $2M, most HNW buyers should run the super jumbo numbers alongside a portfolio-funded comparison: at October 2026 rates, the after-tax rate on a 7.39% jumbo passes some published SBLOC rates at that size, because the deduction covers a shrinking share of the loan.
Asset depletion calculators
Asset depletion (also called asset dissipation) is how HNW buyers without traditional W-2 income, founders pre-exit, retired executives, family-office principals, qualify for a jumbo. The mechanic: the lender takes a haircut on eligible liquid assets (typically 70% on taxable brokerage, 60-70% on retirement accounts), divides the haircut balance by the loan term in months, and adds the quotient to documented income for DTI purposes.
A $4M eligible portfolio at a 70% haircut, divided by 360 months, produces $7,778 of imputed monthly income. Add that to a $20K-per-month documented salary and the buyer has $27,778 of qualifying income. At a 43% DTI cap and a 7.39% rate (October 2026), that supports a loan of roughly $1.4M once property tax and insurance are included, versus just under $1M on the salary alone. It does not reach a $3M jumbo: that loan's PITI of about $25,000 a month would need roughly $58,000 of monthly qualifying income. The math is simple; the calculation is lender-specific because every jumbo desk uses a different haircut and divisor. A dedicated asset depletion calculator standardizes the comparison.
The cluster A spokes build out the math for each loan type. The pillar's role is to flag which one applies based on loan size and income structure: under $832,750 use a conforming calculator (not covered here), $832,750 to ~$1.25M use a jumbo PITI tool, above $1.25M run super jumbo, and at any loan size where W-2 income alone fails DTI, layer in asset depletion.
Which portfolio-funded calculator fits: SBLOC, PAL, or piggyback?
This is stockstead.com's defensible niche. Generic mortgage calculators do not model portfolio-secured financing because the typical user does not have an investment portfolio large enough to pledge against a home purchase. For HNW buyers with $1M+ in taxable brokerage assets, portfolio-funded structures often produce a lower all-in cost than a conventional jumbo, particularly above the $750K deduction cap. Per FINRA's Securities-Backed Lines of Credit Investor Alert, these structures are widely available at major brokerages, but the math required to compare them against a conventional mortgage is non-trivial.
SBLOC mortgage calculators
A securities-backed line of credit (SBLOC) is a revolving credit line secured by a pledged taxable brokerage account. The rate is typically priced as a spread over SOFR (3.87% as of October 8, 2026) per the New York Fed's reference rate. As of October 8, 2026, published all-in rates on a $1M draw across major brokers ran from 4.93% (Interactive Brokers Pro margin, a margin loan rather than a purpose-built SBLOC) to 6.77% (Schwab Pledged Asset Line, list price), with Fidelity's securities-backed line at 6.22%; relationship pricing can move any of these. SBLOC interest is generally not deductible as home acquisition indebtedness under IRC Section 163(h)(3) because the loan is secured by the portfolio, not the home. A dedicated SBLOC mortgage calculator handles the non-deductibility, the maintenance LTV math, and the comparison against a conventional jumbo's after-tax effective rate.
For the explainer-style background on SBLOC mechanics, the existing posts on SBLOC vs HELOC for HNW homeowners and how an SBLOC works in detail are the companion reads.
Pledged Asset Line (PAL) calculators
A Schwab PAL is structurally identical to an SBLOC but priced on Schwab's specific schedule, with relationship concessions for Schwab Bank Private Client tiers. The PAL calculator differs from a general SBLOC calculator only in its rate-schedule inputs: it should accept Schwab's published spread over SOFR, which steps down as the loan value of the pledged collateral grows (SOFR + 4.40% at the $100K tier, 3.90% at $250K, 3.40% at $500K, 2.90% at $1M, and 2.40% at $2.5M+; 6.77% all-in at the $1M tier as of October 8, 2026), and apply the Private Client concession (25-50 bp for clients with $1M+ in qualifying assets). The math otherwise mirrors the SBLOC calculator.
For the venue-specific deep dive on Schwab PAL, the Schwab Pledged Asset Line for a home purchase post walks through the rate schedule, application timeline, and worked examples.
Piggyback 80/10/10 vs SBLOC hybrids
The traditional piggyback structure (80% first mortgage + 10% second mortgage + 10% cash down) was popularized to avoid PMI. For HNW buyers, the more relevant piggyback hybrid is 80% jumbo + 20% SBLOC, where the SBLOC funds the down payment from pledged portfolio assets without liquidating them. A piggyback calculator built for the HNW case compares this hybrid against an 80/20 with cash down and a 100% portfolio-funded purchase.
The cluster B spokes build each portfolio-funded calculator in detail. The pillar's role is the routing logic: if the buyer has $1M+ in taxable brokerage and is purchasing above the $750K deduction cap, the portfolio-funded category is the first place to look; the deductibility math of a conventional jumbo loses its edge above the cap, where each extra mortgage dollar costs the full non-deductible rate, so the SBLOC's own non-deductibility stops being a disadvantage.
After-tax and true-cost calculators
Per IRS Publication 936, the home mortgage interest deduction caps acquisition indebtedness at $750,000 for post-2017 mortgages, a number that has not been indexed for inflation since enactment. For a HNW buyer purchasing a $3M home with a $2.4M jumbo, only 31.25% of the loan balance generates deductible interest. The headline after-tax savings line on a generic calculator typically overstates the benefit by 60-70%. After-tax and true-cost calculators correct for this.
After-tax mortgage calculators
The mechanic: take the headline rate, compute the deductible portion of interest (capped at $750K of principal), apply the buyer's marginal federal rate plus state rate (the deduction only helps if the buyer itemizes above the $32,200 joint standard deduction), and produce an after-tax effective rate on the full loan balance. For a 37%-bracket buyer, OBBBA's new IRC §68 limit disallows 2/37 of the lesser of itemized deductions or taxable income above the 37% threshold ($768,700 joint, $640,600 single, in 2026), so once taxable income clears that threshold by at least the itemized total, each deducted dollar saves 35% federally, not 37%. For such a buyer in a 9% state with a $2.4M jumbo at 7.39% (October 2026), the after-tax effective rate across the full balance is roughly 6.34%, not the 4.14% implied by applying the full deduction. The 220 bp gap drives meaningful differences in the cash vs mortgage comparison and in the 15v30 decision. See the after-tax mortgage calculator spoke for the full conversion math.
For the deeper essay on how the deduction cap reshapes HNW mortgage math, the existing mortgage interest deduction cap explainer is the companion read.
True cost of homeownership calculators
PITI (principal, interest, taxes, insurance) is the starting point. True cost of ownership adds the line items that drive HNW buyers' actual annual carrying costs: HOA in luxury condo buildings ($30K-$120K per year in major metros), maintenance reserve (typically 1-1.5% of home value annually for older luxury homes), insurance shocks in catastrophe markets (California wildfire, Florida hurricane, Texas hail premiums have risen 30-100% since 2020 per various state insurance department reports), property tax escalation in non-Prop-13 states, and capital improvements over a typical 7-10 year hold.
For a $3M home, the spread between PITI and true cost typically runs $40K-$90K per year. A dedicated true cost calculator surfaces this; a generic PITI calculator does not.
Property tax calculators for high-tax HNW states
California, New York, New Jersey, Massachusetts, and a handful of other states have property tax structures that interact with the SALT cap in ways generic calculators miss. A California buyer's property tax is capped at 1% of assessed value under Proposition 13, but assessed value resets on purchase, so a $3M home triggers $30K of annual property tax. The 2026 SALT cap is $40,400, but for a buyer with MAGI above roughly $606,000 it has phased down to the $10,000 floor, which state income tax already consumes. A New York buyer faces effective rates of 1.5-2.5% depending on the county, plus an additional NYC residency layer in the five boroughs. The state-specific property tax mortgage calculator spoke walks through the math for each high-tax HNW market.
The cluster C spokes build the after-tax math out in full. The pillar's role is to make the case that the after-tax effective rate, not the headline rate, is the number that drives the financing decision for high-bracket buyers.
Strategic comparison calculators: cash vs mortgage, 15v30, ARM v fixed
The three strategic-comparison calculators answer questions a single-payment tool cannot. Each requires inputting two financing scenarios and comparing the cumulative cost (or wealth differential) over a multi-year horizon. For HNW buyers, with the Freddie Mac 30-year average at 7.40% as of October 8, 2026, the opportunity-cost math has shifted materially from the 2020-2022 low-rate environment.
Mortgage vs cash purchase calculators
The headline question: does a HNW buyer with $3M in cash buy the $3M home outright, or take a $2.4M jumbo and invest the difference? The illustration below assumes a 7.39% jumbo, the MBA average for the week of Oct 2, 2026. The math depends on the after-tax effective rate on the mortgage (calculator C1's output), the expected after-tax return on the alternative investment, the hold horizon, and the cap-gains drag at exit. For a 37%-bracket buyer in a 9% state (35% + 9% on the deductible slice after the §68 limit), the blended after-tax mortgage rate over ten years is about 6.31%. Because mortgage interest compounds monthly, that is about 6.50% expressed as an annual return, and the tax refund arrives once a year rather than with each payment. Against an expected 6.5% annual after-tax portfolio return, the two paths finish within about $11K of each other after ten years on a $2.4M loan, with paying cash slightly ahead, assuming no refi and the same monthly outflow on both paths. That is a wash. The break-even after-tax return is about 6.54%; at 6.0% the cash purchase comes out about $156K ahead, and at 7.0% the mortgage leads by about $141K. The mortgage vs cash purchase calculator spoke runs the comparison across a range of return assumptions and hold horizons.
For the deeper essay version of this question, a 30-year case study with explicit assumptions, see the existing true opportunity cost of a down payment post.
15 vs 30 year mortgage calculators
The standard 15-vs-30 comparison assumes the buyer values the lower lifetime interest of the 15-year against the higher monthly payment. For HNW buyers, the calculus inverts. The 30-year produces a lower payment, which preserves cash flow that can be invested at a higher after-tax return than the marginal interest saved by the 15-year. The 15-year's lower rate (typically 50-75 bp below the 30-year) is real, but on an after-tax basis it shrinks. Whether the 30-year wins depends on the loan size relative to the $750K cap. At or under the cap, the 30-year usually wins on a wealth-maximizing basis if the freed cash flow is actually invested. Well above the cap at October 2026 rates, it usually does not: on a $2.4M jumbo, the extra principal the 30-year carries is non-deductible at 7.39%, and the 30-year only breaks even at an after-tax return of about 7.6% over 30 years. At 6.5%, the 15-year comes out ahead unless that buyer spends part of the payment freed at payoff. The 15 vs 30 year mortgage calculator spoke runs the after-tax wealth comparison across the full HNW tax-bracket grid.
ARM vs fixed jumbo calculators
ARMs (5/1, 7/1, 10/1) typically price below the fixed jumbo, with the discount varying by lender and structure; as of October 8, 2026, the national 5/1 ARM average was 6.43% against a 7.39% 30-year jumbo average. The break-even math hinges on whether the buyer expects to refi, sell, or otherwise exit the loan before the reset, and on the cap structure of the ARM (typical caps are 2/2/5: 2% first reset, 2% per subsequent year, 5% lifetime). For an HNW buyer with a 5-7 year hold horizon and a credible exit (relocation, upgrade, sale at retirement), the ARM saves meaningful money. For a buyer with a 15+ year hold expectation, the fixed jumbo is the cleaner choice. The ARM vs fixed jumbo calculator spoke surfaces the break-even hold and the reset-risk cost.
The cluster D spokes build each strategic comparison out in full. The pillar's role is to flag that these are decision-support tools, not payment calculators, and the inputs require outputs from categories A, B, and C to be meaningful.
How to use stockstead's SBLOC-vs-HELOC after-tax tool
For the portfolio-funded vs home-equity financing decision specifically, stockstead operates an interactive after-tax SBLOC vs HELOC calculator that handles the comparison directly. The tool takes the buyer's portfolio value and cost basis, the SBLOC rate quoted by the broker, the HELOC rate offered by the bank, the federal and state marginal rates, and the expected hold horizon, and produces the after-tax cumulative cost of each path over the chosen horizon. The model accounts for the deductibility differences (HELOC interest can be deductible under specific facts; SBLOC interest is typically not), the cap-gains drag if the HELOC path requires liquidating any taxable investments to qualify, and the maintenance LTV math on the SBLOC side.
The tool is best used after the buyer has run the basic jumbo PITI calculator (category A1) and the after-tax calculator (category C1) on the conventional mortgage path, then wants to compare against the portfolio-funded alternative. The output is the spread, in dollars over the hold horizon, between the two structures.
The SBLOC vs HELOC essay is the companion artifact to that calculator: the essay explains the framework, the tool runs the math.
When to consult a professional
The math in any mortgage calculator is only as good as the inputs and the assumptions baked in. A calculator can produce an after-tax effective rate to two decimal places, but it cannot tell a buyer whether their specific RSU vesting schedule will count toward DTI at a particular jumbo desk, whether their trust structure permits pledging the brokerage account against an SBLOC, whether their state's homestead protections affect the lender's underwriting, or whether their tax situation supports tracing SBLOC interest as deductible investment interest under IRC Section 163(d) and Publication 550.
For decisions above $1M in loan size, the calculator output is the starting point of a conversation with three professionals, not a substitute for it. A jumbo loan officer (or a private bank relationship manager) confirms what the lender will actually approve and at what rate. A CPA with HNW practice depth confirms the after-tax math against the buyer's specific return profile, including AMT exposure, state tax credits, and the interaction with NIIT. A fiduciary financial advisor confirms whether the financing structure fits the broader balance sheet, the liquidity plan, and the risk tolerance for any pledged-asset structures.
Stockstead publishes educational content and runs calculators that model the comparisons. Stockstead does not provide investment, tax, or legal advice. For the full disclosure on what the site is and is not, see the disclaimers page.
Sources and further reading
- Fannie Mae — 2026 Loan Limits
- Federal Housing Finance Agency — Conforming Loan Limits
- IRS Publication 936 — Home Mortgage Interest Deduction
- IRS Publication 550 — Investment Income and Expenses
- FINRA — Securities-Backed Lines of Credit (Investor Alert)
- SEC — Securities-Based Lending Investor Bulletin
- Federal Reserve Bank of New York — SOFR Reference Rates
- Freddie Mac — Primary Mortgage Market Survey
- Consumer Financial Protection Bureau — Qualified Mortgage Rule
Market rates as of October 8, 2026; worked-example rates are dated October 2026 inputs; limits and tax thresholds are the 2026 figures. Conforming loan limits update annually each November; mortgage rates move daily; tax thresholds change with new legislation. Verify directly with primary sources before sizing a loan. Educational, not financial advice. Stockstead publishes educational content for HNW home buyers and is not a licensed financial advisor, tax advisor, or mortgage broker. Consult a fiduciary advisor, a CPA, and a licensed loan officer before committing to any financing structure.
Frequently asked questions
- What is the best mortgage calculator for high net worth buyers in 2026?
The right mortgage calculator for a high net worth buyer is not a single tool. It is a stack of four: a jumbo or super-jumbo PITI calculator that respects the 2026 baseline conforming limit of $832,750 (and high-cost ceiling of $1,249,125), an asset-depletion qualifier that converts portfolio balances to imputed monthly income, a portfolio-funded calculator (SBLOC or PAL) that models the carry against opportunity cost, and an after-tax calculator that applies the $750K acquisition-indebtedness cap from IRC Section 163(h)(3). Generic calculators from Bankrate or Zillow handle the first piece only.
- Why do generic mortgage calculators fail high earners?
Three structural reasons. First, they assume W-2 income and miss asset-based qualification, which is how most HNW buyers actually clear DTI on a jumbo. Second, they ignore the $750K acquisition cap and the SALT cap, so the headline 'tax savings' line overstates the after-tax benefit at high brackets. Third, they do not model opportunity cost on the down payment or the cap-gains drag from liquidating taxable investments to fund it. The effective rate a high earner pays on a jumbo can differ by 150-200 basis points from the headline rate after taxes.
- What is the 2026 jumbo loan threshold?
The 2026 conforming loan limit for one-unit properties in most US counties is $832,750, per the Federal Housing Finance Agency's November 2025 announcement. In designated high-cost areas (parts of California, New York, Hawaii, DC, and select metros), the ceiling rises to $1,249,125 (150% of the baseline). Any loan above the applicable county limit is a jumbo and underwrites outside Fannie Mae and Freddie Mac standards. The HNW buyer's calculator math changes materially at that line: pricing, reserve requirements, and qualification documentation all shift.
- How does an asset depletion mortgage calculator work?
Asset depletion (also called asset dissipation) converts a portfolio balance into imputed monthly income for DTI purposes. The standard formula divides eligible liquid assets, typically 70% of taxable brokerage and 60-70% of retirement accounts after a haircut, by the loan term in months. A $3M eligible portfolio amortized over 360 months produces roughly $5,800 of imputed monthly income, which the lender adds to actual income to clear DTI. Each lender's haircut and divisor differs, which is why a dedicated asset depletion calculator beats a generic PITI tool for HNW qualifying.
- Should I use a mortgage calculator or an SBLOC calculator for a portfolio-funded purchase?
Both. The mortgage calculator tells you the conventional carry cost. The SBLOC or PAL calculator tells you the portfolio-funded carry cost. Subtract one from the other and you get the spread that funds the purchase decision. On the deductible first $750K, the mortgage usually wins on after-tax cost: a 7.39% jumbo (the MBA average for the week of Oct 2, 2026) nets about 4.80% for a 37%-bracket buyer, whose itemized deductions are worth 35% per dollar under the One Big Beautiful Bill Act, below every published $1M SBLOC rate as of that date (4.93% to 6.77%), though only by about 13 bp against the cheapest. Above the cap, each extra mortgage dollar costs the full non-deductible rate, which was above every one of those SBLOC rates, so the SBLOC often wins on that slice before risk, and on any portion that would otherwise require liquidating low-basis investments. The SBLOC's variable rate and margin-call exposure are the offsets. The Stockstead after-tax SBLOC vs HELOC calculator models the spread directly.
- What is the mortgage interest deduction cap for high income buyers?
For mortgages originated after December 15, 2017, the home mortgage interest deduction caps acquisition indebtedness at $750,000 ($375,000 if married filing separately) under IRC Section 163(h)(3), per IRS Publication 936. For pre-2018 mortgages, the cap is $1,000,000. Interest on the portion of any mortgage above the applicable cap is non-deductible. For a $2M jumbo on a primary residence, that means only the interest on the first $750K is deductible, roughly 37.5% of total interest in year one of a 30-year amortization. The One Big Beautiful Bill Act, signed July 4, 2025, made the $750,000 cap permanent.
- Does a mortgage calculator account for state taxes and the SALT cap?
Most do not. The state and local tax (SALT) cap bundles property tax, state income tax, and local taxes into a single federal deduction ceiling. The One Big Beautiful Bill Act raised it to $40,400 for 2026, but the cap shrinks by 30% of modified AGI above $505,000, down to a $10,000 floor that applies from roughly $606,000 of MAGI, and it reverts to $10,000 for everyone in 2030. For a high-earning buyer in California, New York, or New Jersey, state income tax alone usually fills whatever cap remains, leaving no deductible room for the property tax on a $3M home. Buyers with MAGI near the $505,000 threshold get more room, but the phase-down means each extra dollar of income above it also costs deduction. That changes the after-tax cost of ownership by thousands of dollars per year, a number the headline calculator never shows.
- Where do I start if I am comparing financing structures?
Start with the four-calculator stack: jumbo PITI for the base case, after-tax for the true cost, asset depletion if W-2 alone does not clear DTI, and SBLOC/PAL for the portfolio-funded comparison. For most HNW buyers, the operative question is not 'what is my payment' but 'what is the lowest after-tax effective rate I can achieve across all available structures.' That is a four-tool comparison, not a one-tool answer.
Ready to run the numbers on your situation?
Open the calculator →Related posts
Jumbo Mortgages for HNW Buyers: When Banks Still Win
SBLOC is not always the answer. For many HNW home purchases, especially loans near the $750K deduction cap, a jumbo at the right bank is cheaper, safer, and cleaner.
High Net Worth Home Buyer Financing: The Complete Guide
Cash, jumbo mortgage, SBLOC, hybrid, and asset-depletion — the five paths to fund an HNW home purchase. After-tax math, decision framework, and links to deeper guides.
$2M Portfolio, $2M Home: A Case Study in Three Financing Paths
A fully worked $2M-portfolio / $2M-home case study — built originally as my own modeling exercise — with the surprises called out: the path that costs $2.26M, the path that ends up $1.3M richer, and the assumption that secretly decides which is which.