ARM vs Fixed Jumbo Mortgage Calculator: 2026 Break-Even Math
By Tyler Singletary · · Updated · in Decision frameworks
A 5/1 jumbo ARM typically prices below a 30-year fixed jumbo; jumbo desks have historically quoted the gap at roughly 75 to 150 basis points, per Bankrate's ARM rates tracker and the Freddie Mac Primary Mortgage Market Survey. As of October 8, 2026, the national 5/1 ARM average was 6.43% against a 7.39% 30-year jumbo fixed average. In this post's $2M example at those October 2026 averages (a 6.43% ARM against a 7.39% fixed, a 96 bp gap), that is worth about $1,285 a month during the initial fixed period. Whether the savings hold up over the life of the loan depends on three variables an ARM vs fixed jumbo mortgage calculator has to model directly: the cap structure, the post-reset rate trajectory, and the buyer's actual hold horizon.
This is a comparison-focused spoke of the HNW mortgage calculator pillar. It walks through the structural mechanics of 5/1, 7/1, and 10/1 jumbo ARMs, the standard 2/2/5 cap, a worked $2M break-even example, and the after-tax overlay that compresses the ARM advantage for high-bracket buyers above the $750K deduction cap.
Market rates on this page are as of October 8, 2026. The worked examples use a 6.43% 5/1 ARM (the national 5/1 average on Oct 8, 2026) and a 7.39% fixed (the MBA 30-year jumbo average for the week of Oct 2, 2026), stated where they appear. The rate table further down is a May 2026 illustration. Jumbo ARM rates move daily and vary by lender. Freddie Mac PMMS publishes weekly; Bankrate's ARM rate tracker updates daily. Verify the actual quoted rate with a jumbo desk before sizing.
What is a jumbo ARM and how does it differ from a 30-year fixed jumbo?
A jumbo ARM is an adjustable-rate mortgage above the FHFA's 2026 conforming loan limit of $832,750 (or the $1,249,125 high-cost ceiling), typically priced below the comparable 30-year fixed jumbo (as of October 8, 2026, the national 5/1 ARM average was 6.43% against a 7.39% 30-year jumbo fixed average). The structure carries an initial fixed period (typically 5, 7, or 10 years) followed by annual rate adjustments tied to a SOFR or constant-maturity Treasury index.
The mechanic. During the initial fixed period, the ARM rate behaves identically to a 30-year fixed, the buyer pays the same monthly principal and interest amount each month. At the first reset, the rate adjusts to the index value plus a contractual margin (typically 2.25-3.00% over the index), subject to the cap structure described below. Adjustments then occur annually, every 12 months from the first reset, for the remaining loan term.
For HNW buyers at the jumbo loan tier, the ARM structure is most relevant when the expected hold horizon is shorter than the initial fixed period plus 2-3 years of post-reset cushion. A buyer with a credible 5-7 year hold (relocation, upgrade, retirement liquidation) captures the full rate discount on a 5/1 and exits before or shortly after the first reset. A buyer with a 15+ year hold takes the reset risk for the entire post-fixed period.
How the 5/1, 7/1, and 10/1 structures compare
The first number is the initial fixed period in years. The second number is the adjustment frequency in years (always "1" on modern jumbo ARMs, annual adjustments after the fixed period ends). A 5/1 fixes the rate for five years and then adjusts annually. A 7/1 fixes for seven. A 10/1 fixes for ten.
The rate-discount trade-off is roughly linear with the length of the initial fixed period. The table below shows the illustrative pricing this post was built on in May 2026, against a 30-year fixed jumbo assumed at 6.85%. As of October 8, 2026, the 30-year jumbo fixed average was 7.39% and the national 5/1 ARM average 6.43%; get live 7/1 and 10/1 quotes from a jumbo desk.
| Structure | Illustrative rate (May 2026 assumption) | Discount vs 30-year fixed |
|---|---|---|
| 5/1 ARM | 5.35-5.85% | 100-150 bp |
| 7/1 ARM | 5.75-6.25% | 60-110 bp |
| 10/1 ARM | 6.15-6.50% | 35-70 bp |
The 5/1 carries the largest discount but the shortest fixed period. The 10/1 narrows the discount to the point where most HNW buyers find the optionality of a true 30-year fixed worth the 35-70 bp give-up. The 7/1 sits in the middle and is, in our experience working through hundreds of these comparisons, the most common HNW selection when the buyer wants ARM economics with operational breathing room.
What is the 2/2/5 cap structure and why does it matter?
The 2/2/5 cap is the standard jumbo ARM rate-adjustment ceiling: 2% maximum increase at the first reset, 2% maximum increase per subsequent annual adjustment, and 5% maximum increase over the life of the loan above the initial rate. Per the CFPB's Consumer Handbook on Adjustable-Rate Mortgages, the three caps work together as a stack, not separately, and the lifetime cap is the binding constraint in any high-rate scenario.
Worked stress test. A 5/1 ARM at 6.43% with a 2/2/5 cap structure has the following worst-case path. Year 1-5: 6.43% (fixed period). Year 6: 8.43% (first reset, capped at +2%). Year 7: 10.43% (capped at +2% per year). Year 8: 11.43% (capped at +5% lifetime ceiling). The 11.43% rate is the absolute worst case for the remaining 23 years of the loan, regardless of what the underlying index does.
For a $2M jumbo, the year-6 payment shock under the worst-case path runs from $12,549 per month (6.43% on a 30-year amortization) to roughly $14,975 per month (8.43% recomputed against the remaining balance). Year 7 at 10.43% pushes it to about $17,509, and the year-8 worst case at 11.43% to about $18,801. An ARM vs fixed calculator that does not model these stress paths is hiding the most consequential variable.
Floor caps and the index-plus-margin formula
Most jumbo ARMs also include a rate floor, typically the margin itself or the initial rate, meaning the rate cannot adjust below a specified minimum even if the index falls dramatically. The post-reset rate formula is straightforward: index value at reset date plus contractual margin, then constrained by the cap stack. With SOFR at 3.87% as of October 8, 2026 per the New York Fed's reference rate and typical jumbo ARM margins of 2.25-2.75%, the fully indexed rate is simply SOFR plus that margin; compare that sum against the initial rate you are quoted. On Oct 8, 2026, that sum was about 6.12-6.62%, close to the 6.43% average initial 5/1 rate, so at that moment a reset would not have meant a payment shock. The risk is SOFR rising before your reset. When the fully indexed rate sits well above the initial rate, the cap structure is what protects the buyer from the full move at the first reset.
What does a $2M jumbo ARM vs fixed comparison actually look like?
For a representative HNW buyer, the comparison breaks like this. Assume a $2M jumbo loan, 30-year term. This example assumes a 7.39% 30-year fixed (the MBA jumbo average for the week of Oct 2, 2026) and a 6.43% 5/1 ARM (the national 5/1 average on Oct 8, 2026), a 96 bp discount. Rerun the numbers with your actual quotes. Both are interest-only-eligible at most jumbo desks, but for cleaner math, this example uses full P&I amortization.
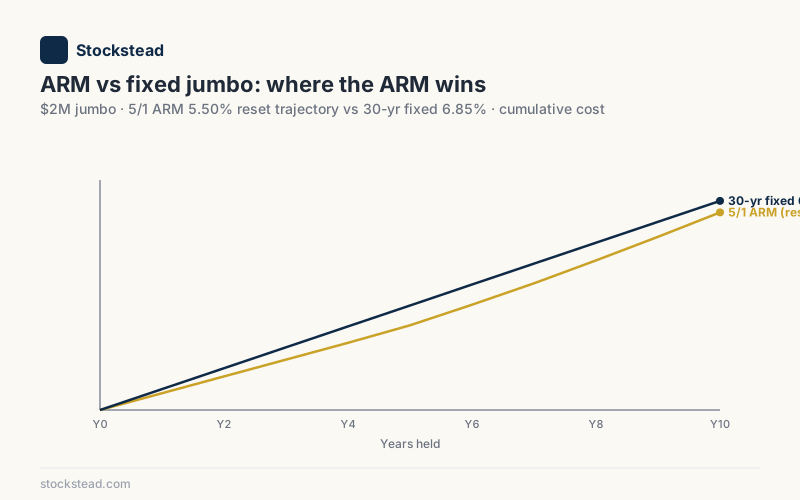
The initial period math. Monthly P&I on the 30-year fixed at 7.39% is approximately $13,834. Monthly P&I on the 5/1 ARM at 6.43% is approximately $12,549. The ARM saves $1,285 per month during the initial fixed period, or about $15,400 per year. Over five years, cumulative payment savings total roughly $77,000 of pre-tax cash flow, and interest savings about $97,000. The loan-balance trajectory also favors the ARM modestly: after five years it owes about $1.871M versus $1.890M on the fixed, because more of each payment goes to principal at the lower rate.
The break-even question, measured on cumulative interest (equivalently, payments plus the balance still owed). If the ARM resets to the original fixed rate (7.39%) at year 6 and stays there, it never breaks even: the buyer keeps the five years of savings and from then on pays about the same rate on a slightly smaller balance. The same holds if it resets to today's fully indexed rate of about 6.62% or lower. If the ARM follows the worst-case path (8.43%, then 10.43%, then 11.43%), it is still about $23,000 ahead after year 7, and the fixed becomes cheaper during year 8; by year 10 the fixed is ahead by about $199,000.
Hold horizon as the decision variable
In our experience walking buyers through this calculator, the operative question is not "will rates rise" but "will the buyer still own the home when it matters." For a 5-7 year hold horizon, the ARM wins even on the worst-case path in this example, because the buyer exits before that path erases the savings. The margin is smaller than in the May 2026 version of this example (96 bp of initial discount rather than 135 bp), so a buyer whose hold could stretch to year 8 is closer to the line. For a 15+ year hold, the fixed is the cleaner choice, the buyer is not paying for optionality they will not use, and the cumulative cost in any moderately-bad reset scenario favors the locked-in rate.
The middle case, 8-12 year hold, is where the calculator earns its keep. Small changes in the reset-rate assumption swing the cumulative cost comparison by tens of thousands of dollars. The honest output is a range, not a point estimate, and the buyer should make the decision with the worst-case path visible alongside the expected case.
How does the after-tax overlay change the ARM vs fixed math?
Per IRS Publication 936, the home mortgage interest deduction caps acquisition indebtedness at $750,000 for post-2017 mortgages. For a $2M jumbo, that means only 37.5% of total interest is deductible regardless of whether the loan is structured as ARM or fixed, a constraint that compresses the after-tax value of any rate discount on the full balance. The headline ARM savings shrink meaningfully on an after-tax basis.
Worked after-tax. The 96 bp gross rate advantage on the 5/1 ARM (6.43% vs 7.39%) translates to an after-tax effective spread of roughly 80 bp for a 37%-bracket buyer in a 9% state, once the $750K cap is applied. The federal piece is 35%, not 37%: OBBBA's new IRC §68 limit disallows 2/37 of the lesser of a top-bracket filer's itemized deductions or taxable income above $768,700 (joint; $640,600 single), so each deducted dollar is worth 35% once taxable income clears that line by the itemized total. Still meaningful, but the cumulative five-year payment savings drop from about $77,000 pre-tax to roughly $61,000 after accounting for the smaller deduction on the ARM's lower interest. For the conversion math, see the after-tax mortgage calculator.
This matters most when the buyer is comparing the ARM not just to the fixed, but to the mortgage-vs-cash-purchase decision or the 15-vs-30-year tradeoff. The after-tax effective rate is the right number to compare across structures, and a calculator that does not surface it gives the wrong answer to high-bracket buyers above the deduction cap. For the broader HNW financing decision framework, the HNW mortgage calculator pillar maps the full four-calculator stack.
What does the calculator actually need to model?
A useful ARM vs fixed jumbo calculator takes the following inputs and produces three outputs: monthly payment under both structures, cumulative cost across a chosen hold horizon, and break-even year under both expected and worst-case reset paths.
Required inputs. Loan size and term. Fixed rate (30-year). ARM structure (5/1, 7/1, 10/1) and initial rate. ARM cap structure (default to 2/2/5; allow override). Index assumption for post-reset (SOFR plus margin, with a user-adjustable forward path). Federal and state marginal tax rates. Expected hold horizon in years. Optional: cap-gains rate and basis on any liquidated assets if the buyer is comparing against a cash purchase alternative.
Required outputs. The monthly payment delta during the fixed period. The cumulative interest paid over the hold horizon under the expected case and the worst case. The break-even year under both. The after-tax effective rate on each structure, accounting for the $750K cap. And, crucially, the payment shock at year 6 under the worst-case reset, which is the number that decides whether the buyer can actually carry the loan if rates move against them.
The reset-risk cost the calculator should surface
The number we have found most useful in practice is not break-even or cumulative cost, but rather the conditional expected cost of the reset path. Calculate the cumulative ARM cost under three rate-trajectory assumptions: (a) rates fall 100 bp, (b) rates stay flat, (c) rates rise to the worst-case cap path. Weight by the buyer's subjective probability, or weight them equally for a base case. The output is a single dollar figure that integrates the reset risk in a way break-even alone does not. Most generic ARM calculators only show case (b).
FAQ
What is the rate spread between a 5/1 jumbo ARM and a 30-year fixed jumbo in 2026?
It moves with the market and varies by lender and tier; jumbo desks have typically quoted the 5/1 roughly 75 to 150 basis points below the 30-year fixed. As of October 8, 2026, the national 5/1 ARM average was 6.43% and the 30-year jumbo fixed average was 7.39%. This post's $2M worked example uses a 6.43% ARM against a 7.39% fixed (October 2026 averages, a 96 bp gap), which saves about $1,285 per month during the initial fixed period. The spread narrows on 7/1 and 10/1 structures.
When does a 5/1 ARM beat a 30-year fixed jumbo on cumulative cost?
Almost always during the initial five-year fixed period. On a $2M loan against a 7.39% fixed, a 75-150 bp rate advantage saves roughly $60K-$119K of payments (about $76K-$151K of interest) over five years; at the 96 bp gap of October 2026, about $77K of payments and $97K of interest. After the reset, the answer depends on the post-reset rate environment. If the ARM resets to the fixed rate or lower and stays there, it never gives those savings back. If rates rise to the worst-case cap path, the fixed catches up during year 8. Hold horizon is the decision variable.
What is the worst-case rate on a 5/1 jumbo ARM with a 2/2/5 cap?
Initial rate plus 5%. A 5/1 ARM starting at 6.43% with a 2/2/5 cap can reset to at most 8.43% at the first adjustment (year 6, +2%), then 10.43% in year 7 (+2%), and ultimately cap at 11.43% from year 8 (+5% lifetime). The 11.43% lifetime ceiling is the number to stress-test against. If the buyer cannot service that payment, the ARM is the wrong structure.
How does the $750K deduction cap affect the ARM vs fixed decision?
It compresses the after-tax spread between the two structures. Per IRS Publication 936, only interest on the first $750K of acquisition debt is deductible. On a $2M jumbo, that means 37.5% of total interest is deductible regardless of whether the loan is ARM or fixed. The after-tax savings from a 100 bp ARM advantage on the full balance shrinks to roughly 87 bp on an after-tax effective basis in the 37% federal bracket, where OBBBA's limit on itemized deductions caps each deducted dollar's value at 35% (100 bp × (1 − 37.5% × 35%)).
Should I refinance my jumbo ARM before the reset?
Usually, if rates have not risen materially. The standard refi math applies: estimated closing costs of roughly 1-3% of loan balance versus the cumulative payment savings over the expected hold past the reset. For HNW buyers with a sub-50% LTV at refi time, lender competition is intense and closing costs can be lender-credited. The decision is rarely whether to refi, it is whether to refi into another ARM or into a fixed.
Sources and further reading
- Freddie Mac — Primary Mortgage Market Survey
- Bankrate — Current ARM Rates
- Consumer Financial Protection Bureau — Adjustable-Rate Mortgages
- Consumer Financial Protection Bureau — Consumer Handbook on Adjustable-Rate Mortgages (CHARM)
- Federal Housing Finance Agency — Conforming Loan Limits
- Federal Reserve Bank of New York — SOFR Reference Rates
- IRS Publication 936 — Home Mortgage Interest Deduction
Market rates as of October 8, 2026; worked-example rates are dated October 2026 averages; the ARM rate table is a May 2026 illustration. Jumbo ARM rates, the Freddie Mac PMMS 30-year fixed average, and SOFR move daily. Verify any rate or limit directly with primary sources and a jumbo desk before sizing a loan. Educational, not financial advice. Stockstead publishes educational content for HNW home buyers and is not a licensed financial advisor, tax advisor, or mortgage broker. Consult a fiduciary advisor, a CPA, and a licensed loan officer before committing to any financing structure. See disclaimers for the full disclosure.
Frequently asked questions
- What is the rate spread between a 5/1 jumbo ARM and a 30-year fixed jumbo in 2026?
It moves with the market and varies by lender and tier; jumbo desks have typically quoted the 5/1 roughly 75 to 150 basis points below the 30-year fixed. As of October 8, 2026, the national 5/1 ARM average was 6.43% and the 30-year jumbo fixed average was 7.39%. This post's $2M worked example uses a 6.43% ARM against a 7.39% fixed (October 2026 averages, a 96 bp gap), which saves about $1,285 per month during the initial fixed period. The spread narrows on 7/1 and 10/1 structures, where the longer initial period is priced closer to the fixed.
- What is a 2/2/5 cap structure on a jumbo ARM?
The 2/2/5 cap is the standard jumbo ARM rate-adjustment ceiling: 2% maximum increase at the first reset, 2% maximum increase per subsequent annual adjustment, and 5% maximum increase over the life of the loan above the initial rate. Per the CFPB's Consumer Handbook on Adjustable-Rate Mortgages, the lifetime cap is the most consequential of the three for HNW buyers, it defines the worst-case interest rate the loan can ever reach.
- When does a 5/1 ARM beat a 30-year fixed jumbo on cumulative cost?
Almost always during the initial five-year fixed period. On a $2M loan against a 7.39% fixed, a 75-150 bp rate advantage saves roughly $60K-$119K of payments (about $76K-$151K of interest) over five years; at the 96 bp gap of October 2026, about $77K of payments and $97K of interest. After the reset, the answer depends on the post-reset rate environment. If the ARM resets to the fixed rate or lower and stays there, it never gives those savings back. If rates rise to the worst-case cap path, the fixed catches up during year 8. Hold horizon is the decision variable.
- Are jumbo ARMs available in 7/1 and 10/1 structures?
Yes. Most major jumbo lenders offer 5/1, 7/1, and 10/1 structures, with some private banks also offering 3/1 and 15/1. The 7/1 and 10/1 carry longer fixed periods at the cost of a narrower rate discount versus the 30-year fixed, typically 50-100 bp on the 7/1 and 25-75 bp on the 10/1. For HNW buyers with a 5-10 year expected hold, the 7/1 often produces the best risk-adjusted tradeoff.
- How does the $750K mortgage interest deduction cap affect the ARM vs fixed decision?
It compresses the after-tax spread between the two structures. Per IRS Publication 936, only interest on the first $750K of acquisition debt is deductible. On a $2M jumbo, that means 37.5% of total interest is deductible regardless of whether the loan is ARM or fixed. The after-tax savings from a 100 bp ARM advantage on the full balance shrinks to roughly 87 bp on an after-tax effective basis in the 37% federal bracket, where OBBBA's limit on itemized deductions caps each deducted dollar's value at 35% (100 bp × (1 − 37.5% × 35%)).
- What is the worst-case rate on a 5/1 jumbo ARM with a 2/2/5 cap?
Initial rate plus 5%. A 5/1 ARM starting at 6.43% with a 2/2/5 cap can reset to at most 8.43% at the first adjustment (year 6, +2%), then 10.43% in year 7 (+2%), and ultimately cap out at 11.43% from year 8 (+5% lifetime). The 11.43% lifetime ceiling is the number to stress-test against. If the buyer cannot service that payment, the ARM is the wrong structure.
- Should I refinance my jumbo ARM before the reset?
Usually, if rates have not risen materially. The standard refi math applies: estimated closing costs of roughly 1-3% of loan balance versus the cumulative payment savings over the expected hold past the reset. For HNW buyers with a sub-50% LTV at refi time, lender competition is intense and closing costs can be lender-credited. The decision is rarely about whether to refi, it is about whether to refi into another ARM or into a fixed.
Ready to run the numbers on your situation?
Open the calculator →Related posts
Super Jumbo Mortgage Calculator: Loans Above $1.25M
Super jumbo mortgage calculator: private-bank pricing above $1.25M, 12-24 month reserve requirements, tighter DTI, and worked $2.4M math against the $750K cap.
Mortgage Calculator for High Net Worth: Complete 2026 Guide
HNW mortgage calculator guide: jumbo PITI above $832,750, asset depletion income, after-tax rates under the $750K cap, and SBLOC vs. mortgage comparisons.
Jumbo Mortgage Calculator: 2026 Limits, PITI, and HNW Math
2026 jumbo mortgage calculator: $832,750 baseline threshold, $1,249,125 high-cost ceiling, PITI math, and how jumbo DTI qualifying differs from conforming.