True Cost of Homeownership Calculator: Beyond PITI
By Tyler Singletary · · Updated · in Decision frameworks
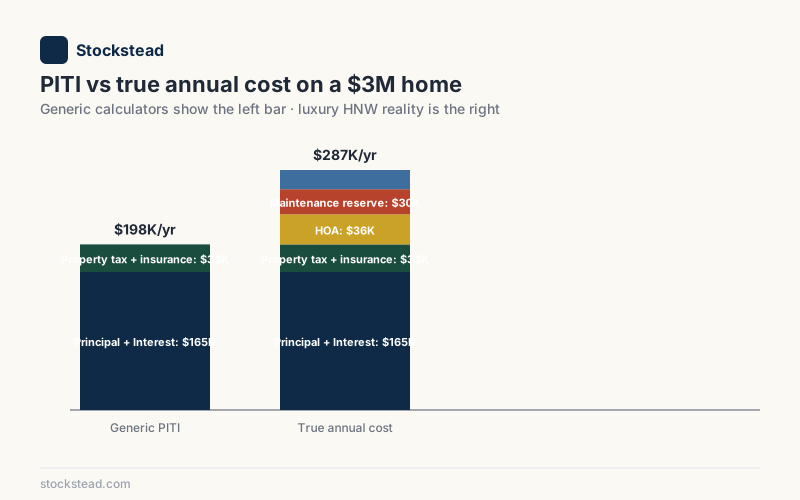
Most mortgage calculators stop at PITI: principal, interest, taxes, and insurance. For an HNW buyer purchasing a $3M home, PITI is roughly two-thirds of the actual annual carrying cost. The other third sits in the line items the generic calculator omits, luxury HOA or condo dues, maintenance reserve on an older luxury property, insurance shocks in California wildfire and Florida hurricane and Texas hail markets, property tax escalation in non-Prop-13 states, and capital improvements amortized across a typical 7-10 year hold. The spread between PITI and true cost is not a rounding error. It is the difference between an affordability decision that holds for a decade and one that quietly compresses cash flow every year until the buyer is house-poor on paper while liquid on the balance sheet.
This guide is the spoke for the true cost of homeownership calculator in the stockstead.com HNW mortgage calculator cluster. It walks through the five line items PITI omits, the formula for converting each into an annualized number, and a worked example on a $3M home that surfaces the typical $40K-$90K per year spread. For the after-tax conversion of the headline rate that pairs with this true-cost view, see the after-tax mortgage calculator spoke.
Cost data current as of May 24, 2026. Insurance premiums, HOA dues, and property tax assessments change continuously. Verify any line item with a current quote, the most recent HOA budget, or the latest assessor's notice before sizing carrying cost on a specific home.
What PITI Leaves Out of the HNW Cost Equation
For a $3M home, PITI typically runs $180K-$220K per year at an assumed mid-6% mortgage rate. Rates have since moved: as of October 8, 2026, the 30-year fixed average is 7.40% per Freddie Mac's Primary Mortgage Market Survey and the 30-year jumbo average is 7.39%, so PITI at today's rates runs higher than this range. True annual cost on the same home runs $220K-$310K once HOA, maintenance, insurance escalation, tax escalation, and amortized capital improvements are added back. The PITI line understates true cost by 15-30% on the typical HNW property.
The omission is not malicious; it is structural. PITI was designed for the median conforming buyer purchasing a single-family suburban home priced near the conforming limit. For that buyer, HOA is often zero, maintenance is owner-DIY at a few thousand dollars per year, insurance is a flat $1,500-$3,000 annual premium, and property tax escalates predictably. The HNW buyer's cost stack is fundamentally different. Luxury condo HOA dues alone often exceed the median household's full housing budget. Maintenance on an older brownstone or a 1920s estate runs into six figures over any meaningful hold. Insurance on a $3M home in Pacific Palisades or Naples or Highland Park is a different product than the $1,500 HO-3 policy the standard calculator assumes.
The fix is a true cost of homeownership calculator that surfaces each omitted line as an explicit input. The buyer plugs in their actual numbers (or reasonable ranges from market data), and the calculator produces a defensible annual carrying cost that matches what the bank account will actually see. The next five sections walk through each line.
Luxury HOA and Condo Dues: $30K to $180K Per Year
For a Manhattan luxury condo or a high-end gated community, HOA or common-charge dues typically run $30K-$120K per year, with ultra-prime buildings (Billionaire's Row in NYC, ultra-luxury Miami Beach towers, La Jolla oceanfront) hitting $150K-$300K. These dues fund building staff, amenities, capital reserves, ground lease payments on land-lease properties, and the building's master insurance policy. PITI excludes all of it.
The reason HNW HOA dues skew so high: the staffing model and the amenity overhead. A full-service Manhattan condo with a 24/7 doorman, concierge, building engineer, porter, and superintendent runs payroll into the millions annually, allocated across units. Add a pool, gym, screening room, spa, residents' lounge, and rooftop, and the per-unit annual carry climbs further. Land-lease buildings (a meaningful slice of the prewar Manhattan luxury stock) layer a ground rent escalator on top, which can double a building's HOA over a long enough horizon.
For a true cost calculator, the input mechanic is straightforward: pull the most recent HOA budget from the building's offering plan or annual statement, and ask the broker for the projected dues increase. Most luxury buildings escalate dues 3-7% annually. For underwriting purposes, model the dues at year-five rather than year-one to capture the compounding. A $60K HOA at 5% annual escalation grows to roughly $77K by year five and $98K by year ten. The "current dues" figure on the listing sheet is a snapshot, not a forecast.
For an HNW buyer comparing a $3M condo against a $3M single-family home, the HOA delta alone often runs $50K-$80K per year. That delta has compounding consequences for the affordability comparison: $60K of HOA invested at a 6% after-tax return instead compounds to roughly $790K over a decade. The single-family path is not always cheaper (maintenance and discretionary capital catch up), but the comparison cannot be made without putting HOA on the line.
Maintenance Reserve: 1 to 1.5 Percent of Home Value Annually
The standard maintenance rule of thumb is 1% of home value annually. For HNW homes, the realistic range runs 1-1.5% for typical luxury construction and 1.5-2% for older homes (50+ years) or properties with significant deferred maintenance. On a $3M home, that is $30K-$60K per year as an annualized reserve, even in years when no major project hits.
Why HNW homes skew higher than the rule of thumb: the labor and materials premium. Trades qualified to work on a $3M home (a finish carpenter who can match prewar moldings, an HVAC contractor experienced with geothermal or VRF systems, an electrician certified for integrated AV and smart-home controls) bill at 1.5-3x the rates of standard residential trades. Materials are spec'd up: solid hardwood instead of engineered, stone instead of quartz, custom millwork instead of stock cabinetry. When a kitchen needs a refresh, it is a $200K refresh, not a $30K one.
The maintenance line also captures the routine annual upkeep most owners forget to budget: roof inspections, gutter cleaning, HVAC service contracts, pest control, landscaping, pool service, security system monitoring, irrigation system winterizing, exterior painting touch-ups, and the dozens of $500-$2,000 line items that aggregate to $15K-$30K per year on a luxury property before any single major repair. Per the U.S. Bureau of Labor Statistics CPI for owners' equivalent rent and maintenance, maintenance costs have risen roughly 25-35% from 2020 to 2025, materially above headline CPI, reflecting the labor and materials inflation specific to construction trades.
The mechanic for a calculator: input home value, select an age and condition tier (newer construction at 0.75-1%, standard luxury at 1-1.5%, older or deferred-maintenance at 1.5-2%), and surface the annualized reserve. The buyer either holds the reserve in a sinking fund or accepts the carry as a budget line. Either way, the number belongs on the cost calculation, not off it.
Insurance Shocks in Catastrophe Markets: 30 to 100 Percent Premium Increases Since 2020
For HNW homes in California wildfire zones, Florida hurricane corridors, Texas hail markets, and an increasing list of secondary catastrophe geographies, insurance has become a major cost line and a serious operational concern. Per filings tracked by the California Department of Insurance, multiple admitted carriers including State Farm, Allstate, and Travelers have paused new policies or filed for 30-50% rate increases citing wildfire reinsurance costs. Per the Florida Office of Insurance Regulation, average homeowner premiums rose roughly 40-60% from 2020 to 2024 statewide, with coastal premiums climbing further. Per the Texas Department of Insurance, hail and convective storm losses have driven 25-50% premium increases across hail-prone metros including DFW, Austin, and the Hill Country.
For HNW homes specifically, the dollar impact is large. A $3M home in Pacific Palisades or Malibu that carried a $12K annual premium in 2020 often quotes $35K-$60K in 2026 if it can find admitted coverage at all, with many homes pushed into the California FAIR Plan plus wrap-around surplus-lines coverage. A $3M home in Naples or Palm Beach often runs $40K-$80K annually, particularly for properties with wind exposure or pre-2001 construction (which underwrites less favorably under modern building codes). A $3M home in a Texas hail metro often runs $15K-$35K annually with high all-perils deductibles structured as percentages of insured value rather than flat dollar amounts.
The mechanic for a calculator: pull the current annual premium from the most recent declarations page or a fresh quote, then add an escalation assumption that reflects the catastrophe trajectory in the specific market. A flat 3-5% escalation is appropriate for non-catastrophe markets; for California wildfire, Florida hurricane, and Texas hail markets, modeling 8-15% annual escalation is realistic given the 2020-2025 trajectory. Per Federal Reserve Bank of Dallas research on Texas housing and insurance trends, the insurance premium share of total housing cost has roughly doubled in affected metros over five years.
For a $3M home with a $30K starting premium escalating at 10% annually, the year-five premium is roughly $48K and the year-ten premium is roughly $78K. The cumulative ten-year insurance carry is roughly $478K, an order of magnitude above what a generic calculator's flat "1% of home value" insurance assumption would produce.
Property Tax Escalation in Non-Prop-13 States
California buyers benefit from Proposition 13's 2% annual reassessment cap on tax basis, per the California State Board of Equalization's Proposition 13 reference. The cap does not protect new buyers (assessed value resets to market at purchase), but it does protect long-term holders from runaway escalation. Outside California, no equivalent statewide cap exists in most HNW markets, and property tax escalation can run 5-15% annually in appreciating markets.
Texas is the marquee case. No state income tax, but effective property tax rates run 2-2.8% of market value in major HNW metros (Dallas, Austin, Houston suburbs), with annual reassessments that track market appreciation. A $3M Highland Park home that paid $60K in property tax at purchase in 2020 often pays $85K-$100K in 2026 after five years of double-digit Texas appreciation. The Texas property tax cap (a 10% annual increase limit on homesteaded properties under the state constitution) provides some protection, but the limit does not apply to the assessed value catch-up; it applies year over year on the homestead figure.
New Jersey, Illinois, and parts of New York face similar dynamics. Effective rates of 1.5-2.5% combine with annual reassessments that track or exceed local appreciation. A $3M home in Short Hills, NJ or Highland Park, IL often pays $50K-$75K in property tax with growth of 3-7% per year on the assessment basis plus periodic rate adjustments. New York City carries an additional layer of city-level resident tax and an opaque assessment methodology that often produces sharp reassessment shocks in specific years.
For a true cost calculator, the input mechanic: starting property tax (from the seller's most recent tax bill or the assessor's office), a state-specific escalation assumption (2% in California for ongoing hold, 5-10% in Texas and other appreciating non-cap states, 3-5% in mature Northeast markets), and the hold horizon. The calculator surfaces the year-five and year-ten tax line, which often runs 30-60% above year-one in non-cap states.
For the state-specific deep dive on HNW property tax across California, Texas, New York, New Jersey, Florida, and Massachusetts, see the property tax mortgage calculator for HNW states spoke. The dynamics differ enough by state that a single national property tax assumption is meaningfully wrong for almost every HNW buyer.
Capital Improvements Amortized Across the Hold
Over a typical 7-10 year HNW hold, most luxury homes absorb at least one major capital project: a kitchen remodel ($100K-$400K), a primary bath ($50K-$200K), a roof or HVAC replacement ($30K-$150K), exterior work like windows or stucco ($50K-$250K), a landscape overhaul ($50K-$250K), or a finished basement / ADU addition ($150K-$500K). Per National Association of Home Builders cost data on luxury construction, per-square-foot costs for high-spec residential work run roughly $400-$800 nationally and $600-$1,500 in coastal HNW markets.
The cumulative capital improvement budget over a decade on a $3M home typically runs $200K-$600K, or $20K-$60K per year amortized. This is separate from the maintenance reserve line. Maintenance covers keeping existing systems running; capital improvements upgrade or replace systems and finishes. A roof at end of life is a capital line. A leaking valve repaired by a plumber is a maintenance line. The distinction matters because capital improvements add to cost basis for capital gains purposes at exit, while maintenance does not.
A true cost calculator should let the buyer input expected capital projects and amortize them across the hold horizon. The buyer enters: $200K kitchen in year three, $80K roof in year six, $50K windows in year eight. Total: $330K over a 10-year hold, amortized at $33K per year. Some calculators add a default 0.5-1% of home value annual capital allowance for buyers who do not want to project specific projects, which is a reasonable proxy but typically underestimates for HNW properties.
Worked Example: $3M Home, PITI vs True Cost
Concrete numbers. Buyer is purchasing a $3M home with a $2.4M jumbo at an assumed 6.85%, 20% down, in a representative HNW market. The PITI line below is the floor the jumbo calculator spoke produces; this section adds the five lines a jumbo PITI tool omits. The 6.85% rate is an illustrative input from when this example was built; the 30-year jumbo average is 7.39% as of October 8, 2026, and the figures below are not recomputed at that rate. The PITI line:
| Component | Annual cost |
|---|---|
| Principal + interest ($2.4M, 30-year, 6.85%) | $189,300 |
| Property tax (year one, 1.2% of value) | $36,000 |
| Insurance (standard $3M HO policy, non-catastrophe market) | $6,500 |
| PITI total (year one) | $231,800 |
PITI is $232K per year. A generic mortgage calculator stops here. Now add the five omitted lines, using market-typical mid-range numbers:
| Line | Annual cost |
|---|---|
| HOA / condo dues (if applicable, mid-tier luxury building) | $48,000 |
| Maintenance reserve (1.25% of $3M home value) | $37,500 |
| Insurance escalation (5% annual, year-five figure) | $2,000 (added to year-one) |
| Property tax escalation (year-five figure, non-cap state) | $7,000 (added to year-one) |
| Capital improvements (amortized $300K over 10 years) | $30,000 |
| True cost additions (year-five blended) | $124,500 |
True cost (year-five blended): $356,300 per year. The spread between the PITI line and true cost is $124,500 annually, or 54% above the headline PITI figure. For a single-family home (no HOA), the spread compresses to roughly $76,500, still 33% above PITI.
Over a 10-year hold, the cumulative gap between PITI and true cost on this $3M property runs roughly $1.2M for the condo case and $750K for the single-family case. That is real money. It is the difference between a financing decision that holds together at year ten and one that quietly forces the buyer to draw on portfolio assets to fund the carrying cost.
For an HNW buyer running an affordability or rent-vs-buy analysis, the operative number is true cost, not PITI. The PITI line is what the bank cares about for DTI qualification. The true cost line is what the buyer's balance sheet actually sees. Both matter; only one is on a generic calculator.
How to Build the True Cost Number for Your Specific Home
The mechanic, end to end, for any specific property under consideration:
- Compute PITI using the jumbo mortgage calculator or any standard tool. This is the floor.
- Pull HOA dues from the building's most recent budget or the listing agent. Add a 4-6% annual escalation assumption. Use the year-five figure for steady-state cost.
- Set the maintenance reserve at 1-1.5% of home value annually for typical luxury, 1.5-2% for older or deferred-maintenance properties. Hold in a sinking fund or treat as annual budget line.
- Quote current insurance from a broker. For catastrophe markets, model 8-15% annual escalation. For non-catastrophe markets, 3-5% is reasonable.
- Apply state-specific property tax escalation from the HNW property tax calculator spoke. 2% in California, 5-10% in non-cap states, 3-5% in mature Northeast markets.
- Amortize expected capital improvements across the hold horizon. Default to 0.5-1% of home value annually if no specific projects are projected; otherwise itemize.
- Sum the annualized lines to produce true cost. Compare against PITI to surface the spread.
- Apply the after-tax effective rate from the after-tax mortgage calculator to the interest portion of PITI for the after-tax true cost.
For the broader case study on how HNW buyers reconcile true cost against portfolio income and after-tax math, see the $2M portfolio, $2M home case study and the HNW home buyer financing guide.
When to Consult a Professional
A true cost calculator surfaces the cost lines that PITI omits, but the numbers it produces are estimates based on market-typical assumptions. The actual carrying cost on a specific home depends on facts only the buyer's professionals can confirm. A real estate broker familiar with the building or neighborhood confirms HOA escalation history, building capital plans (special assessments are not in current dues), and local property tax assessment behavior. An insurance broker quotes the actual premium and confirms whether admitted coverage is available or whether the home will require surplus lines. A CPA confirms which line items add to cost basis at exit and how the after-tax effective ownership cost actually settles.
For decisions on homes above the $1.5M-$2M range, the true cost number is the starting point of a budgeting conversation, not a substitute for one. The downside of underestimating true cost is structural: the buyer commits to a property whose carrying cost compresses cash flow every year for the entire hold, often pushing the balance sheet toward forced asset liquidation at exactly the moment markets are difficult.
Stockstead publishes educational content and runs calculators that model the cost lines. Stockstead does not provide investment, tax, real estate, or insurance advice. For the full disclosure on what the site is and is not, see the disclaimers page.
Sources and further reading
- Freddie Mac — Primary Mortgage Market Survey
- IRS Publication 936 — Home Mortgage Interest Deduction
- Federal Housing Finance Agency — Conforming Loan Limits
- California Department of Insurance — Residential Insurance Market Reports
- Florida Office of Insurance Regulation — Property Insurance Data
- Texas Department of Insurance — Residential Property Insurance Reports
- U.S. Bureau of Labor Statistics — Consumer Price Index, Maintenance
- California State Board of Equalization — Proposition 13
- National Association of Home Builders — Construction Cost Data
- Federal Reserve Bank of Dallas — Texas Housing and Insurance Trends
Cost data current as of May 24, 2026. Insurance premiums, HOA dues, property tax assessments, and construction cost benchmarks change continuously and vary materially by specific property and market. Verify any line item with a current quote, the most recent HOA budget, the assessor's notice, or a licensed insurance broker before sizing carrying cost on a specific home. Educational, not financial advice. Stockstead publishes educational content for HNW home buyers and is not a licensed financial advisor, tax advisor, real estate broker, or insurance broker. Consult a fiduciary advisor, a CPA, a real estate professional, and a licensed insurance broker before committing to any home purchase decision.
Frequently asked questions
- What does a true cost of homeownership calculator add to PITI?
It adds five line items PITI ignores: HOA or condo dues (often $30K-$120K per year in luxury buildings), an annual maintenance reserve of 1-1.5% of home value for older homes, insurance escalation in catastrophe markets where premiums have risen 30-100% since 2020 per state insurance department filings, property tax escalation in non-Prop-13 states, and capital improvements amortized over a 7-10 year hold. On a $3M home, those five lines typically add $40K-$90K per year on top of PITI.
- How much should I budget for maintenance on a luxury home?
The standard rule of thumb is 1% of home value annually, but HNW homes skew higher: 1-1.5% for older luxury homes, 1.5-2% for homes over 50 years old or with significant deferred maintenance, and 0.5-1% for newer construction. The drivers are specialty systems (geothermal HVAC, integrated AV, smart-home controls), higher-spec materials, and the labor premium for trades qualified to work on a $3M-plus property. For a $3M home, budget $30K-$45K per year as a baseline.
- Why have home insurance premiums spiked in California, Florida, and Texas?
Catastrophe risk reinsurance costs have climbed sharply since 2020. Per the California Department of Insurance, multiple admitted carriers have paused new policies or filed for rate increases of 30-50% citing wildfire reinsurance. Per the Florida Office of Insurance Regulation, average homeowner premiums rose roughly 40-60% from 2020 to 2024. Per the Texas Department of Insurance, hail and convective storm losses have driven 25-50% premium increases across hail-prone metros. HNW homes in these states often carry premiums of $20K-$80K per year on a $3M policy.
- How does Proposition 13 change the property tax math for California buyers?
Proposition 13 caps annual reassessment growth at 2%, but assessed value resets to market value at purchase. For a $3M California home, year-one property tax runs roughly 1.1-1.25% of purchase price ($33K-$37.5K) depending on local assessments and Mello-Roos overlays. The cap protects long-term holders from runaway escalation, but new buyers reset to current market. In non-Prop-13 states like Texas or New Jersey, reassessments can drive 5-15% annual property tax growth in appreciating markets.
- How should I amortize capital improvements over a typical hold?
Budget for one major capital project per 7-10 year hold on a luxury home: a kitchen remodel ($100K-$400K), a primary bath ($50K-$200K), a roof or HVAC replacement ($30K-$150K), or exterior work like windows and stucco ($50K-$250K). On a $3M home, the cumulative capital improvement budget over a decade typically runs $200K-$600K, or $20K-$60K per year amortized. A true cost calculator should let you input expected projects and amortize them across your hold horizon.
- Does PITI include HOA dues?
Standard PITI does not. The acronym covers Principal, Interest, Taxes, and Insurance only. The expanded version, PITIA, adds Association dues, which is the more honest line for condo and HOA-governed properties. For luxury Manhattan condos, common-charge plus property tax often runs $5K-$15K per month, which translates to $60K-$180K per year on top of mortgage payment. Any calculator that omits HOA on a luxury condo purchase is misstating the carrying cost by 30-50%.
- What is the typical spread between PITI and true cost on a $3M HNW home?
Typically $40K-$90K per year, or 15-30% above the PITI line. The spread widens for older homes (higher maintenance reserve), catastrophe-exposed markets (higher insurance), luxury condo buildings (higher HOA), and non-Prop-13 states with appreciating markets (higher tax escalation). For an HNW buyer running an affordability or rent-vs-buy decision, using PITI as the cost basis understates true carrying cost by the price of a second car, every year, for the entire hold.
Ready to run the numbers on your situation?
Open the calculator →Related posts
After-Tax Mortgage Calculator: True Net Cost of Your Payment
After-tax mortgage calculator for HNW buyers: the $750K cap, the 2026 SALT phase-down, and a 7.39% jumbo that prices to about 6.4% after tax, not 3.99%.
Super Jumbo Mortgage Calculator: Loans Above $1.25M
Super jumbo mortgage calculator: private-bank pricing above $1.25M, 12-24 month reserve requirements, tighter DTI, and worked $2.4M math against the $750K cap.
SBLOC Mortgage Calculator: After-Tax vs Jumbo for HNW Buyers
SBLOC mortgage calculator for HNW buyers: after-tax math, the $750K deduction cap, a worked $2.4M portfolio-funded vs jumbo comparison, and rates as of October 8, 2026.