SBLOC Mortgage Calculator: After-Tax vs Jumbo for HNW Buyers
By Tyler Singletary · · Updated · in Decision frameworks
A securities-backed line of credit (SBLOC) is the standard portfolio-funded alternative to a jumbo mortgage for HNW buyers with $1M+ in taxable brokerage assets. The math is not obvious because the headline rates are close, but the after-tax cost diverges sharply once the loan size crosses the $750K mortgage-interest deduction cap. This post is the calculator-focused walkthrough: what to compute, in what order, with what inputs, and how the comparison flips at the cap. For the broader framework on which calculators an HNW buyer needs, start with the mortgage calculator pillar for HNW buyers.
Market rates in this post are shown as of October 8, 2026. The worked examples use fixed rates as of October 8, 2026, stated where they appear. SBLOC rates move with SOFR, which is published daily by the Federal Reserve Bank of New York. Jumbo rates move with the broader mortgage market, tracked weekly by the Freddie Mac Primary Mortgage Market Survey. Verify the live rates with your broker and lender before sizing any draw.
What an SBLOC mortgage calculator actually computes
An SBLOC mortgage calculator models the cost of funding a home purchase with a portfolio-secured loan instead of, or alongside, a property-secured mortgage. Per the SEC's Securities-Based Lending Investor Bulletin, these structures are widely available at major brokerages but underwritten on a non-purpose basis, meaning the calculator math differs from any standard PITI tool.
The four required inputs: the SBLOC rate quoted by your broker, the comparison jumbo rate from your lender, the loan principal, and your marginal federal and state tax rates. Two derived outputs matter most. The after-tax effective rate on each path, and the cumulative cost over the planned hold horizon. The deductibility split is the single biggest driver of the gap, because the SBLOC's headline rate equals its effective rate while the jumbo's effective rate depends on how much of the principal sits under the $750K acquisition cap.
A useful calculator also surfaces three risk metrics that PITI tools never compute. Maintenance LTV cushion, capital-gains drag on any forced liquidation, and the opportunity cost of leaving pledged assets compounding under the SBLOC instead of liquidating them to fund a larger down payment. The Stockstead SBLOC vs HELOC after-tax calculator runs all three. The sections below walk through each computation by hand so you can verify the tool's output against your numbers.
How is SBLOC interest taxed differently from mortgage interest?
Per IRS Publication 936, home mortgage interest deduction requires the loan to be secured by the residence and recorded as a lien against it. An SBLOC fails both tests because it is secured by the pledged brokerage account, not the home. The interest is therefore non-deductible personal interest under the default tax treatment. The headline rate equals the after-tax effective rate, with no adjustment.
The conventional jumbo works differently. Under IRC Section 163(h)(3), codified at 26 USC Section 163, interest on the first $750,000 of acquisition indebtedness on a primary residence is deductible against ordinary income, subject to itemization and the AMT interaction. The One Big Beautiful Bill Act, signed July 4, 2025, made that cap permanent. For a 37% federal bracket buyer, the deduction is now worth a little less than 37%: under OBBBA's new IRC Section 68 limit, starting in 2026 a 37%-bracket filer loses 2/37 of the smaller of their itemized deductions or their taxable income above the 37% threshold ($768,700 joint, $640,600 single), so each deducted dollar saves 35% once income clears that threshold by at least the itemized total. For such a buyer in California (9.3% state, SALT cap already consumed by state income tax), the after-tax effective rate on the deductible portion is the headline rate times (1 minus 35%), or 65% of the headline. At the 7.39% jumbo average as of October 8, 2026, that is roughly 4.80% on the first $750K of principal.
A narrow exception exists for SBLOC interest. If the buyer can trace the loan proceeds to a taxable investment, not a home purchase, and the buyer files an election under IRC Section 163(d) per Publication 550, the SBLOC interest qualifies as investment interest deductible against investment income. Most home-purchase use cases do not support this tracing because the proceeds wire directly to the closing agent. Default the calculator to fully non-deductible SBLOC interest. Consult a CPA before relying on any tracing structure.
What inputs do you need to run the comparison?
The minimum input set: portfolio value, portfolio cost basis, SBLOC rate, jumbo rate, loan principal, federal marginal rate, state marginal rate, hold horizon. Per FINRA's Securities-Backed Lines of Credit Investor Alert, brokers price SBLOCs on a spread schedule over SOFR. As of October 8, 2026, published all-in rates on a $1M draw were 4.93% at IBKR Pro margin, 5.40% for Morgan Stanley's promotional fixed LAL rate, 6.22% at Fidelity, and 6.77% for Schwab's Pledged Asset Line at list price.
The rate inputs
For the SBLOC side, use the all-in rate your broker quoted for your specific line size and relationship tier, not the published table. With SOFR at 3.87% per the New York Fed, published rates on a $1M draw as of October 8, 2026:
| Broker / product | Pricing basis | All-in on $1M |
|---|---|---|
| Interactive Brokers Pro margin | IBKR benchmark plus a tiered spread, blended | 4.93% |
| Morgan Stanley Liquidity Access Line | 1-year fixed promotional rate (floating schedule not published) | 5.40% |
| Fidelity securities-backed line of credit | SOFR plus a spread tiered by line size | 6.22% |
| Schwab Pledged Asset Line, list price | SOFR plus a spread tiered by collateral loan value | 6.77% |
The Schwab row above is the $1M tier only. Schwab prices its Pledged Asset Line on a five-band schedule set by the loan value of the pledged collateral (SOFR + 4.40% at $100K down to SOFR + 2.40% at $2.5M and up, as of October 8, 2026), with a separate relationship discount of 0.25% to 1.00% layered on top, plus per-asset-class advance rates that drive maximum line size. For the venue-specific math with all five tiers, the concession threshold, and the blended-advance-rate formula preloaded, the Schwab Pledged Asset Line calculator spoke is the right tool. Use this generic SBLOC framework for the SBLOC-vs-jumbo decision; switch to the Schwab-specific spoke once the structure is chosen and the rate needs to be tier-derived rather than user-supplied.
For the jumbo side, use the rate your private bank or mortgage broker quoted. The Freddie Mac PMMS average for 30-year fixed is the conforming benchmark; jumbo rates run within 25-50 basis points of that figure on either side depending on the lender's portfolio appetite. As of October 8, 2026, the PMMS 30-year fixed averaged 7.40% and the MBA jumbo 30-year averaged 7.39%. The 2026 jumbo threshold per the Federal Housing Finance Agency is $832,750 (or $1,249,125 in high-cost counties).
The tax inputs
Federal marginal rate is straightforward, 37% for most HNW buyers in the top bracket, though the Section 68 limit above means a deduction is worth 35% to them. State marginal rate matters but interacts with the SALT cap. For 2026 the cap is $40,400, but it shrinks by 30% of MAGI above $505,000 until it reaches a $10,000 floor, so a buyer in the 37% bracket is at the floor (the cap reverts to $10,000 for everyone in 2030). For a California, New York, or New Jersey buyer whose state income tax already exceeds the cap, the state portion of the marginal deduction is zero because the SALT cap is already consumed. For a Texas, Florida, or Washington buyer with no state income tax, the state input is also zero, but for a different reason. Either way, the calculator should default to using only the federal marginal rate for the deduction unless the buyer has SALT headroom. The deduction also assumes you itemize; with a jumbo's interest on top of state taxes, an HNW buyer's itemized total clears the $32,200 joint standard deduction easily.
The basis input
Portfolio cost basis matters because it sets the capital-gains drag on the liquidate-and-pay-cash counterfactual. A $500K position with a $250K cost basis generates a $250K long-term gain on full liquidation, which at the federal LTCG rate of 23.8% (20% plus 3.8% NIIT) plus state produces $60K-$80K in immediate tax. The SBLOC avoids that tax entirely by leaving the position untouched. For a low-basis portfolio (founder stock, decades-held index positions), the avoided tax often justifies the SBLOC even when the headline rate sits above the jumbo's after-tax rate.
A worked example: $2.4M purchase, jumbo vs SBLOC at October 2026 rates
This example uses rates as of October 8, 2026: a 7.39% jumbo (the MBA 30-year jumbo average) and the published all-in SBLOC rates on a $2.4M draw at four venues. Rerun the math at the rates you are quoted. The simplest comparison that exposes the cap effect: a $3M home purchase with $600K cash down, leaving $2.4M to finance. The buyer has a $4M brokerage account, a 37% federal bracket (taxable income comfortably above the $768,700 joint threshold, so the deduction is worth 35%), and lives in a state where SALT is already capped (California, with state income tax well above the $10,000 floor that applies at this income). Two financing paths.
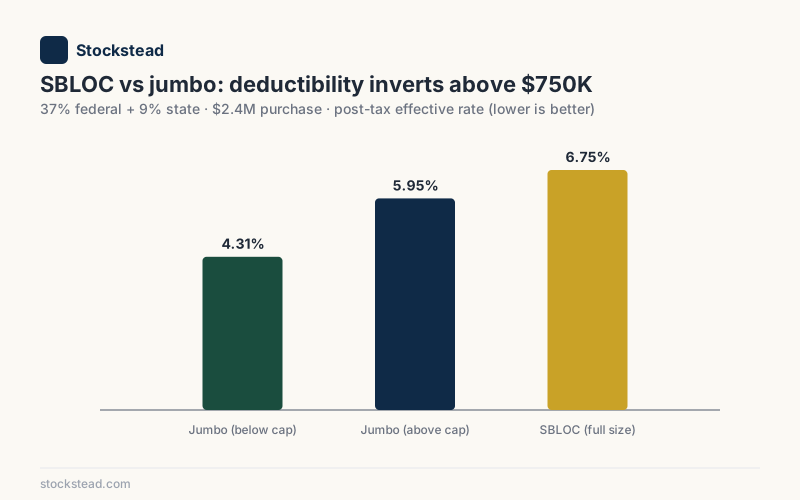
Path A: Conventional jumbo at 7.39%. Year-one interest on a 30-year amortizing jumbo at 7.39% is roughly $176,600 on the $2.4M starting balance (monthly principal and interest of about $16,600). The first $750K of principal generates deductible interest, $55,200 of the total. The remaining $1.65M of principal generates $121,400 of non-deductible interest. At a 37% federal bracket, with the deduction worth 35% after Section 68, the tax savings on the deductible portion is $19,300. After-tax year-one interest cost is $176,600 minus $19,300, or $157,300. That is 6.55% of the $2.4M loan; on a pure rate basis, the blended after-tax rate is 6.58%.
Path B: $2.4M SBLOC. Interest-only on the line, fully non-deductible, so the effective rate equals the headline rate. Year-one cost at each venue's published all-in rate on a $2.4M draw:
| SBLOC venue (Oct 8, 2026) | All-in rate on $2.4M | Year-one interest | vs jumbo's $157,300 after tax |
|---|---|---|---|
| IBKR Pro margin (blended tiers) | 4.75% | $114,100 | SBLOC cheaper by $43,200 |
| Morgan Stanley LAL (1-year fixed promo, ends Nov 6, 2026) | 5.40% | $129,600 | SBLOC cheaper by $27,700 |
| Fidelity securities-backed line ($1M–$3M tier) | 6.22% | $149,300 | SBLOC cheaper by $8,000 |
| Schwab Pledged Asset Line, list ($1M–$2.5M tier) | 6.77% | $162,500 | Jumbo cheaper by $5,200 |
On year-one interest alone, the answer depends on the venue. The break-even is about 6.6%: any SBLOC priced below that beats the jumbo at this loan size, and any SBLOC priced above it loses. Schwab's list rate is the one case where the jumbo still wins, and that flips easily. Schwab sets its tier by the loan value of the pledged collateral, so if this $4M account supports $2.5M or more of loan value, the list rate drops to 6.27% and the SBLOC wins by about $6,800. A relationship discount of 0.50% gets to the same 6.27%. The cap is doing real work either way. But the comparison is incomplete because it ignores the principal amortization on the jumbo (the SBLOC requires no principal payment, freeing cash flow for other uses) and the opportunity cost of the $600K cash down on Path A versus a portfolio-funded down payment on Path B. The full ten-year wealth comparison also depends on the buyer's expected portfolio return.
For the side-by-side ten-year comparison with all line items, the SBLOC vs HELOC after-tax calculator runs the math on inputs you control. Plug in your quoted jumbo and SBLOC rates (or the example's 7.39% and 6.77% to reproduce the Schwab row), $2.4M for the loan size, and your tax bracket. The output is the cumulative dollar spread over your chosen hold horizon.
How does the comparison flip above the $750K cap?
Below $750K of principal, the conventional jumbo wins on after-tax cost for a high-bracket buyer, but by less than it used to. The full headline rate is deductible at the marginal federal rate, so a jumbo costs 65% of its headline rate after tax for a 37% federal buyer (the deduction is worth 35% after Section 68): about 4.80% at the 7.39% average as of October 8, 2026. The cheapest SBLOC we track, IBKR Pro margin, priced about 4.95% on a $750K draw that day, fully non-deductible. That is a margin of roughly 15 basis points. The rule to watch: the jumbo wins below the cap only while the cheapest SBLOC you can get stays above 65% of the jumbo rate. If SOFR falls or jumbo rates rise, that can change.
Above the cap, the deductibility advantage shrinks loan-size-by-loan-size as the non-deductible portion grows. On a $1.5M jumbo, the deductible share is 50% of principal; on a $3M jumbo, 25%; on a $5M jumbo, 15%. The blended after-tax effective rate climbs toward the headline rate as the loan grows. At some loan size, the jumbo's blended rate crosses the SBLOC's headline rate, and the SBLOC becomes the cheaper path on cumulative interest.
The crossover loan size depends on the rate spread. Solving for it: the jumbo's blended after-tax rate equals the jumbo rate times (1 minus the deduction's value, 35% here, times $750K divided by the loan). Set that equal to the SBLOC rate and solve for the loan size. With a 7.39% jumbo and a 37% federal buyer with SALT already capped (rates as of October 8, 2026), the break-even SBLOC rate by loan size is:
| Loan size | Jumbo blended after-tax rate | The SBLOC wins if its rate is below |
|---|---|---|
| $1.0M | 5.45% | 5.45% |
| $1.5M | 6.10% | 6.10% |
| $2.0M | 6.42% | 6.42% |
| $2.4M | 6.58% | 6.58% |
| $3.0M | 6.74% | 6.74% |
| $5.0M | 7.00% | 7.00% |
Put venue rates against that table and the crossover lands in very different places: about $0.79M against IBKR Pro margin (about 4.95% in that range), about $0.98M against Morgan Stanley's 5.40% promotional fixed rate, about $1.66M against Fidelity's 6.22% line, and about $3.1M against a 6.77% line such as Schwab's list price on its $1M–$2.5M tier. Schwab's $2.5M-and-up tier lists at 6.27%, which already beats the jumbo at that size. Above the crossover, the SBLOC's lower headline rate wins on the non-deductible portion that dominates. Below it, the jumbo's deduction on the first $750K dominates.
This crossover is the single most important number in the comparison, and it is what generic mortgage calculators never compute. Add the avoided capital-gains drag on liquidation, and the SBLOC's effective break-even loan size drops further. For a buyer with low-basis taxable positions, the SBLOC can be the cheaper path even at loan sizes below the headline crossover, because the avoided gain realization adds another 5-10% of effective cost savings.
What about the maintenance LTV and call risk?
Per FINRA, SBLOC maintenance LTVs typically sit at 70% on diversified collateral, with initial draw caps lower (often 50% on diversified portfolios, less on concentrated positions). The calculator should compute the portfolio drop tolerance at initial draw, then surface the result alongside the cost comparison because the carry cost and the call risk are not interchangeable.
Crude formula. Portfolio drop tolerance equals 1 minus (initial LTV divided by maintenance LTV). For a $2.4M draw against a $4M portfolio, initial LTV is 60%. With a 70% maintenance threshold, the buyer's drop tolerance is 1 minus (60% / 70%), or 14.3%. A 14.3% portfolio drop triggers a call, which is inside the range of normal market corrections, much less recession-scale drawdowns. The 2008 S&P 500 peak-to-trough was 56.8%; the 2020 COVID crash was 33.9% in five weeks. Drawing at 60% initial LTV is a structurally fragile posture.
Compare to drawing $1M against the same $4M portfolio, a 25% initial LTV. The drop tolerance becomes 1 minus (25% / 70%), or 64.3%. The portfolio would need to drop more than the 2008 drawdown before a call. This is the safe posture and the one the Schwab Pledged Asset Line guide recommends as the operational floor. The calculator should warn when the proposed draw produces a drop tolerance below 40%, and require an explicit acknowledgment when below 25%.
For the full stress-test math and the playbook on avoiding forced liquidation, see how to avoid an SBLOC margin call. The carry-cost number a calculator produces is only useful if the buyer can actually carry it through a 2008-scale drawdown without losing the position. For the venue-specific variant of this calculator tuned to Schwab's published spread schedule and relationship discounts, the pledged asset line mortgage calculator builds the same math with Schwab's rate inputs preloaded.
How does qualifying income interact with the SBLOC choice?
The SBLOC has no income documentation. The pledged portfolio is the underwriting, full stop. This is operationally different from a jumbo, where the lender requires two years of tax returns, W-2s, K-1s, paystubs, and an asset statement to support the DTI calculation. For HNW buyers whose income mix is non-traditional, founders pre-exit, recently retired executives living off portfolio income, family-office principals with K-1 income only, the SBLOC's documentation lightness is a meaningful operational advantage.
For buyers who do qualify for a jumbo on income, the SBLOC choice is purely an after-tax cost decision. For buyers who do not qualify on income, the SBLOC is the only path that does not require an asset depletion mortgage qualifier. Asset depletion is the conventional workaround on the jumbo side, the lender takes a haircut on the portfolio and divides by the loan term to impute monthly income for DTI. The calculator math is different from a SBLOC carry calculation, but the underlying portfolio is doing similar work: substituting collateral or imputed income for missing W-2 cash flow.
The decision tree: if DTI clears on income alone, run the after-tax SBLOC vs jumbo comparison and pick the cheaper path. If DTI does not clear, run asset depletion qualifying math against jumbo first; if that still does not clear, the SBLOC is structurally the cleanest option because portfolio value supports the line directly without any imputed-income gymnastics.
How does the SBLOC compare to the piggyback 80/10/10 structure?
The traditional 80/10/10 (80% first mortgage + 10% second mortgage + 10% cash down) was popularized to avoid PMI on conforming loans. For HNW buyers above the conforming limit, the more relevant comparison is 80% jumbo + 20% SBLOC vs 100% SBLOC vs 80% jumbo + 20% cash down. The piggyback vs SBLOC calculator runs that three-way comparison directly.
The piggyback hybrid captures the jumbo's deduction on the first 80% of the purchase price (much of which sits under the $750K cap on smaller homes) while using the SBLOC for the down payment piece without liquidating taxable investments. The math often wins for purchases in the $1M-$2M range where the bulk of the loan sits under the $750K cap. Above that range, the deductible portion shrinks relative to the total loan, and the SBLOC's advantage on the non-deductible balance grows, often making 100% SBLOC the cheaper structure on after-tax cost.
For the related comparison against an HELOC (home equity line, whose interest is deductible only when the proceeds buy, build, or substantially improve the home securing it, a rule the 2025 tax law made permanent), see SBLOC vs HELOC for HNW homeowners. The HELOC is the natural comparison after the purchase has closed; the SBLOC is the natural comparison at the purchase decision.
What about the cash purchase counterfactual?
Some HNW buyers can simply pay cash. The question becomes whether the after-tax SBLOC carry cost is lower than the after-tax opportunity cost of the cash. Rates as of October 8, 2026: for a buyer with $3M in Treasury bills yielding roughly SOFR (3.87%), the yield after 37% federal tax is about 2.44% (T-bill interest is exempt from state tax), so the foregone return on a $2.4M cash deployment is about $58,500 per year. Compare that to a $2.4M SBLOC carry of $114,100 at IBKR Pro margin or $162,500 at Schwab's list rate, and the cash purchase wins on year-one cost at every venue.
The math changes if the alternative deployment is a long-horizon equity portfolio at an expected 7% annual return. The foregone return on $2.4M becomes $168,000 per year, above the SBLOC carry at every venue in the table above, though only by about $5,500 at Schwab's 6.77% list rate. Over a 10-year horizon, the SBLOC's compounding effect on the portfolio is meaningful: leaving $2.4M invested at an expected 7% beats borrowing at 4.75% to 6.77% to keep the same exposure, if the expected return shows up. The mortgage vs cash purchase calculator runs this comparison across a range of expected return assumptions, and the conclusion is heavily sensitive to the assumed return.
The honest answer is that the cash-vs-SBLOC question requires a directional view on equity returns over the hold horizon. The SBLOC bet is implicitly a long-equity, leveraged-portfolio bet. Buyers comfortable with that exposure can run the SBLOC; buyers who would not voluntarily lever a portfolio at 60% LTV through a SBLOC should not do so via a home-purchase backdoor.
Frequently Asked Questions
What is an SBLOC mortgage calculator and how is it different from a jumbo calculator? An SBLOC mortgage calculator models a portfolio-secured loan funding a home purchase, not a property-secured one. The key math difference: SBLOC interest is generally non-deductible under IRC Section 163(h)(3) because the loan is secured by your brokerage account, not the home. A jumbo calculator applies the $750K mortgage interest deduction. In this post's worked example (rates as of October 8, 2026), a 6.77% SBLOC carries an effective rate of 6.77%, while a 7.39% jumbo on the first $750K of principal carries an after-tax effective rate of about 4.80% for a 37% federal-bracket buyer, once the 2026 limit on itemized deductions is applied. The honest comparison requires both calculators, then a blended rate over the full loan size.
Is SBLOC interest tax deductible when used for a home purchase? Generally no. Per IRS Publication 936, home mortgage interest deduction requires the loan to be secured by the residence and recorded as a lien. An SBLOC is secured by the pledged brokerage account, so the interest does not qualify as acquisition indebtedness. A narrow exception exists: if the buyer can trace the loan proceeds to a taxable investment and structure the interest as investment interest under IRC Section 163(d) and Publication 550, deductibility against investment income is possible. Most home-purchase use cases do not support that tracing. Default the calculator to zero deductibility.
When does an SBLOC beat a conventional jumbo on after-tax cost? When its rate sits below the jumbo's blended after-tax rate, which only happens above the $750K acquisition-indebtedness cap. The jumbo's deduction only applies to interest on the first $750K of principal, so on a $2.4M loan, roughly 31% of the interest is deductible and 69% is not. In this post's worked example (rates as of October 8, 2026: a 7.39% jumbo, 37% federal bracket), the jumbo's blended after-tax rate on $2.4M is about 6.58%, so any SBLOC priced below that wins on interest cost. Fidelity's line (6.22%) and IBKR Pro margin (4.75%) clear that bar; Schwab's Pledged Asset Line at its 6.77% list rate does not unless a relationship discount or a larger collateral tier brings it under 6.58%. Approximate crossover loan sizes at those rates: about $0.79M against IBKR, $1.66M against Fidelity, and $3.1M against a 6.77% line. The SBLOC also wins when liquidating taxable investments would trigger meaningful capital gains, because the SBLOC preserves the cost-basis step-up at death and the compounding on unrealized gains.
How do I compute the after-tax effective rate of a jumbo mortgage above the $750K cap? Split the loan into deductible and non-deductible buckets. For the first $750K of principal, the after-tax rate is the headline rate multiplied by one minus the value of your deduction: your marginal federal rate, except that a 37%-bracket buyer should use 35% under the 2026 limit on itemized deductions. Count no state benefit if your state income tax already exceeds your SALT cap, which for 37%-bracket buyers has phased down to the $10,000 floor under the 2025 tax law. For the balance above $750K, the after-tax rate equals the headline rate. Weight the two by their share of the loan. On a $2.4M jumbo at 7.39% (the October 8, 2026 jumbo average) for a 37% federal buyer, the blended after-tax rate is roughly 6.58%, not the 4.80% a naive calculator would show.
What rate should I plug into an SBLOC mortgage calculator? The all-in rate quoted by your specific broker for your line size and relationship tier. Major brokerages price SBLOCs as a spread over a benchmark, usually SOFR, which was 3.87% on October 8, 2026 per the New York Fed. Published rates on a $1M draw as of that date: Schwab's Pledged Asset Line 6.77% at list price (before relationship discounts), Fidelity's securities-backed line 6.22%, IBKR Pro margin 4.93% (blended across its tiers), and Morgan Stanley's 1-year fixed promotional LAL rate 5.40% (its floating schedule is not published). Always use the quoted rate, not a published table, because relationship discounts can move the number materially.
What is the maintenance LTV and how does it affect the calculator math? Maintenance LTV is the threshold at which the broker issues a call. Typically 70% on diversified collateral at Schwab, Fidelity, and most major brokers. The calculator should accept your initial draw size and portfolio value, then compute portfolio drop tolerance as 1 minus (initial LTV divided by maintenance LTV). Drawing $250K against a $2M portfolio at 12.5% initial LTV gives tolerance for an 82% drawdown before a call. Drawing $1M at 50% initial LTV gives only a 29% drawdown cushion, inside historical bear-market range. The carry cost is a real number; the call risk is the optionality cost.
Where can I run the comparison without doing the math by hand? Stockstead operates an interactive after-tax SBLOC vs HELOC calculator at /calculator/sbloc-vs-heloc that takes portfolio value, cost basis, the SBLOC rate quoted by your broker, the HELOC or jumbo rate offered by your bank, federal and state marginal rates, and your hold horizon. It produces the cumulative after-tax cost of each path over the chosen horizon, accounting for deductibility differences, capital-gains drag on any liquidation, and maintenance LTV. It is the calculator implementation of the framework in this post.
Run the math on your actual numbers
The SBLOC vs jumbo decision is a comparison problem, not a single-rate problem. The headline rates look close, but the after-tax math diverges at the $750K cap and again on any liquidation that would trigger capital gains. The four numbers that decide it: your specific loan size, your broker-quoted SBLOC rate, your lender-quoted jumbo rate, and your marginal federal rate. Plug those into the SBLOC vs HELOC after-tax calculator and the output is the cumulative dollar spread over your hold horizon. For the broader context on which calculators an HNW buyer actually needs, the mortgage calculator pillar for HNW buyers walks the full four-category stack.
Sources and further reading
- IRS Publication 936 — Home Mortgage Interest Deduction
- IRS Publication 550 — Investment Income and Expenses
- FINRA — Securities-Backed Lines of Credit (Investor Alert)
- SEC — Securities-Based Lending Investor Bulletin
- Federal Reserve Bank of New York — SOFR Reference Rates
- Freddie Mac — Primary Mortgage Market Survey
- Federal Housing Finance Agency — Conforming Loan Limits
- Cornell LII — 26 USC Section 163(h)(3)
Market rates shown as of October 8, 2026; the worked examples use the October 8, 2026 rates stated in each example. SBLOC rates move with SOFR; jumbo rates move with the broader mortgage market. Verify the live rates with your broker and lender before sizing any draw, and re-run the comparison whenever either rate shifts more than 25 basis points. Educational, not financial advice. Stockstead publishes educational content for HNW home buyers and is not a licensed financial advisor, tax advisor, or mortgage broker. SBLOC structures carry the risk of forced liquidation of pledged assets at unfavorable prices in a margin call. The mortgage interest deduction interaction described above depends on facts specific to your return, including the AMT, state tax credits, and the SALT cap. Consult a CPA and a fiduciary advisor before opening any portfolio-secured credit line or selecting a financing structure. See the disclaimers page for the full disclosure on what the site is and is not.
Frequently asked questions
- What is an SBLOC mortgage calculator and how is it different from a jumbo calculator?
An SBLOC mortgage calculator models a portfolio-secured loan funding a home purchase, not a property-secured one. The key math difference: SBLOC interest is generally non-deductible under IRC Section 163(h)(3) because the loan is secured by your brokerage account, not the home. A jumbo calculator applies the $750K mortgage interest deduction. In this post's worked example (rates as of October 8, 2026), a 6.77% SBLOC carries an effective rate of 6.77%, while a 7.39% jumbo on the first $750K of principal carries an after-tax effective rate of about 4.80% for a 37% federal-bracket buyer, once the 2026 limit on itemized deductions is applied. The honest comparison requires both calculators, then a blended rate over the full loan size.
- Is SBLOC interest tax deductible when used for a home purchase?
Generally no. Per IRS Publication 936, home mortgage interest deduction requires the loan to be secured by the residence and recorded as a lien. An SBLOC is secured by the pledged brokerage account, so the interest does not qualify as acquisition indebtedness. A narrow exception exists: if the buyer can trace the loan proceeds to a taxable investment and structure the interest as investment interest under IRC Section 163(d) and Publication 550, deductibility against investment income is possible. Most home-purchase use cases do not support that tracing. Default the calculator to zero deductibility.
- When does an SBLOC beat a conventional jumbo on after-tax cost?
When its rate sits below the jumbo's blended after-tax rate, which only happens above the $750K acquisition-indebtedness cap. The jumbo's deduction only applies to interest on the first $750K of principal, so on a $2.4M loan, roughly 31% of the interest is deductible and 69% is not. In this post's worked example (rates as of October 8, 2026: a 7.39% jumbo, 37% federal bracket), the jumbo's blended after-tax rate on $2.4M is about 6.58%, so any SBLOC priced below that wins on interest cost. Fidelity's line (6.22%) and IBKR Pro margin (4.75%) clear that bar; Schwab's Pledged Asset Line at its 6.77% list rate does not unless a relationship discount or a larger collateral tier brings it under 6.58%. Approximate crossover loan sizes at those rates: about $0.79M against IBKR, $1.66M against Fidelity, and $3.1M against a 6.77% line. The SBLOC also wins when liquidating taxable investments would trigger meaningful capital gains, because the SBLOC preserves the cost-basis step-up at death and the compounding on unrealized gains.
- How do I compute the after-tax effective rate of a jumbo mortgage above the $750K cap?
Split the loan into deductible and non-deductible buckets. For the first $750K of principal, the after-tax rate is the headline rate multiplied by one minus the value of your deduction: your marginal federal rate, except that a 37%-bracket buyer should use 35% under the 2026 limit on itemized deductions. Count no state benefit if your state income tax already exceeds your SALT cap, which for 37%-bracket buyers has phased down to the $10,000 floor under the 2025 tax law. For the balance above $750K, the after-tax rate equals the headline rate. Weight the two by their share of the loan. On a $2.4M jumbo at 7.39% (the October 8, 2026 jumbo average) for a 37% federal buyer, the blended after-tax rate is roughly 6.58%, not the 4.80% a naive calculator would show.
- What rate should I plug into an SBLOC mortgage calculator?
The all-in rate quoted by your specific broker for your line size and relationship tier. Major brokerages price SBLOCs as a spread over a benchmark, usually SOFR, which was 3.87% on October 8, 2026 per the New York Fed. Published rates on a $1M draw as of that date: Schwab's Pledged Asset Line 6.77% at list price (before relationship discounts), Fidelity's securities-backed line 6.22%, IBKR Pro margin 4.93% (blended across its tiers), and Morgan Stanley's 1-year fixed promotional LAL rate 5.40% (its floating schedule is not published). Always use the quoted rate, not a published table, because relationship discounts can move the number materially.
- What is the maintenance LTV and how does it affect the calculator math?
Maintenance LTV is the threshold at which the broker issues a call. Typically 70% on diversified collateral at Schwab, Fidelity, and most major brokers. The calculator should accept your initial draw size and portfolio value, then compute portfolio drop tolerance as 1 minus (initial LTV divided by maintenance LTV). Drawing $250K against a $2M portfolio at 12.5% initial LTV gives tolerance for an 82% drawdown before a call. Drawing $1M at 50% initial LTV gives only a 29% drawdown cushion, inside historical bear-market range. The carry cost is a real number; the call risk is the optionality cost.
- Where can I run the comparison without doing the math by hand?
Stockstead operates an interactive after-tax SBLOC vs HELOC calculator at /calculator/sbloc-vs-heloc that takes portfolio value, cost basis, the SBLOC rate quoted by your broker, the HELOC or jumbo rate offered by your bank, federal and state marginal rates, and your hold horizon. It produces the cumulative after-tax cost of each path over the chosen horizon, accounting for deductibility differences, capital-gains drag on any liquidation, and maintenance LTV. It is the calculator implementation of the framework in this post.
Ready to run the numbers on your situation?
Open the calculator →Related posts
SBLOC vs HELOC for HNW Homeowners: An After-Tax Comparison
A Home Equity Line of Credit and a Securities-Backed Line of Credit sound similar but behave very differently — and for HNW homeowners, the after-tax math frequently reverses the headline rate gap. Here's the comparison, six variables, and three borrower profiles where the answer is obvious.
Schwab Pledged Asset Line for a Home Purchase: When It Wins, the Process, and the Rate Schedule
When a Schwab Pledged Asset Line beats a jumbo or IBKR margin for a home purchase: the application process, the two LTVs that govern safety, and a worked $1M example.
SBLOC vs Mortgage vs Cash: The Complete HNW Guide
Four ways to fund a $300K down payment from a $2M portfolio, the 10-year math on each at current rates, and the failure mode standard mortgage calculators hide.