Super Jumbo Mortgage Calculator: Loans Above $1.25M
By Tyler Singletary · · Updated · in How it works
Most jumbo mortgage calculators stop being accurate somewhere around the $1.25M loan size. Above that line, the lender pool narrows to private banks and a handful of portfolio-balance-sheet institutions, reserve requirements roughly double, debt-to-income ceilings tighten, and the rate sheet shifts to a different tier. A generic jumbo calculator that applies one rate and one reserve assumption across the full jumbo band will quietly produce qualification answers the underwriter rejects at intake. For a buyer financing $1.5M, $2.4M, or $3.5M of a primary residence, the super jumbo calculator is a structurally different tool, not a cosmetic relabel of the standard jumbo math.
This guide walks through what changes at the super jumbo threshold, what reserves and DTI standards private banks actually apply in 2026, the relationship-pricing concessions that bring the headline rate down, and a worked example on a $2.4M super jumbo at 7.39% to show how the after-tax math reshapes the comparison against a portfolio-funded alternative. For the broader index of HNW mortgage calculator categories, see our mortgage calculator for high net worth buyers pillar. For the math on the standard jumbo band below this threshold, see the jumbo mortgage calculator spoke.
Market rates on this page are as of October 8, 2026. The worked example uses October 2026 pricing: a 7.64% published super jumbo rate (the 7.39% MBA jumbo average for the week of Oct 2, 2026 plus a 25 bp super jumbo premium) negotiated down to 7.39%. The Freddie Mac PMMS 30-year average and SOFR move daily, private bank super jumbo schedules update quarterly, and conforming limits reset each November. Verify any rate or limit with primary sources before sizing a loan.
What counts as a super jumbo in 2026
The super jumbo threshold is lender-specific, not statutory. Per the Federal Housing Finance Agency, the 2026 baseline conforming loan limit is $832,750 with a high-cost ceiling of $1,249,125. Any loan above the applicable county limit is a jumbo. Most private bank desks then internally split the jumbo band into standard jumbo ($833K to roughly $1.25M) and super jumbo (above $1.25M), with the threshold drifting up to $1.5M or $2M at some institutions.
The label matters because the pricing model shifts. Standard jumbo loans are often written with an eye toward securitization or sale to a private-label investor pool, which constrains pricing flexibility and standardizes underwriting. Super jumbo loans are typically held on the lender's own balance sheet from origination, which gives the lender both more pricing latitude and more risk-management discipline. The result: tighter underwriting standards, larger reserve requirements, and a rate tier that reflects the lender's own funding cost rather than an external investor's yield requirement.
For HNW borrowers, the operative consequence is that the lender pool narrows materially above $1.25M. Most regional banks, online jumbo lenders, and conforming-channel correspondent shops do not write super jumbos at scale. The remaining pool, private banks (JPMorgan, Morgan Stanley, Goldman Sachs, Bank of America Private Bank, BNY Mellon Wealth, First Republic successor units), credit unions with wealth arms, and a handful of portfolio non-bank lenders, prices on different criteria than the standard jumbo market.
How the super jumbo calculator math differs from a regular jumbo
A super jumbo calculator must adjust three input categories that a standard jumbo calculator collapses into a single assumption: reserve requirements, DTI ceilings, and rate tiering. Get any one of these wrong and the calculator produces a qualifying answer the underwriter will not approve.
Reserve requirements climb materially
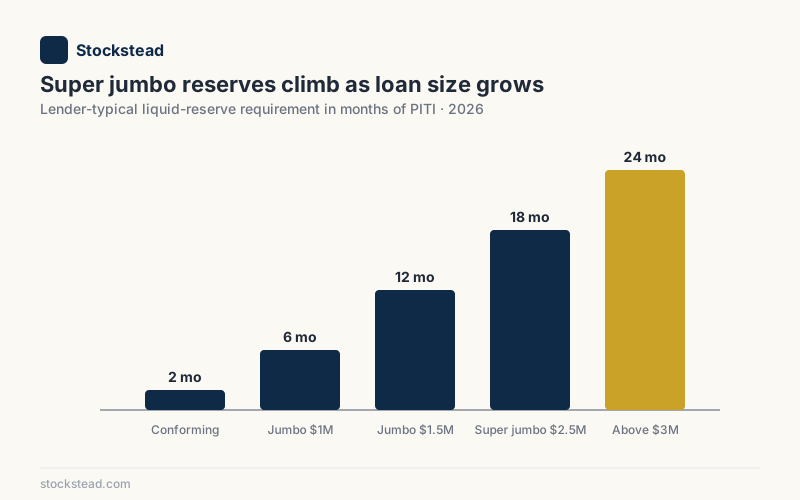
Standard jumbo loans typically require 6-18 months of PITI in verified liquid reserves, depending on loan size and credit profile. Super jumbo loans push that into the 12-24 month range, with some private banks requiring 24-36 months on loans above $3M or on borrowers with non-traditional income mixes. For a $2.4M super jumbo at 7.39% with property tax and insurance of roughly $40K combined annually, the monthly PITI runs near $19,934. A 24-month reserve requirement is about $478,400 in verified liquid assets post-closing.
The reserve calculation is not just a number, it is a definition. Most super jumbo desks accept 100% of cash, money-market balances, and short-term Treasury holdings against the reserve test. Brokerage equity balances typically count at 60-70% (the same haircut used for asset depletion). Retirement accounts count at 60-70% with an additional discount for early-withdrawal penalties if the borrower is under 59-1/2. A calculator that treats reserves as a flat dollar amount without applying the asset-class haircut will overstate the borrower's qualifying buffer by 30-40%.
DTI ceilings tighten by 5-10 points
Conforming loans clear DTI at 45-50% under the qualified mortgage standard published by the Consumer Financial Protection Bureau. Standard jumbo desks typically write to 43-45% DTI. Super jumbo desks tighten further, to 38-43%, reflecting the larger absolute payment exposure and the lender's preference for borrowers with substantial cash-flow cushion above the minimum.
For a borrower with $50K monthly gross income servicing a $19,934 PITI on a $2.4M super jumbo at 7.39%, the front-end ratio is 39.9%. Adding $2,500 of other debt service brings the back-end ratio to 44.9%, outside most super jumbo desks' 38-43% band. A standard jumbo calculator applying a 45% DTI ceiling would show this borrower as qualifying, barely; a super jumbo calculator with the correct tighter ceiling shows a decline unless something changes. The worked example below shows what it takes.
Rate tiering is narrow but real
Super jumbo rates typically run 12-37 basis points above the lender's standard jumbo schedule, per private bank rate sheets across the major desks. The premium reflects the narrower investor pool and the balance-sheet retention dynamic. As of October 8, 2026, the Freddie Mac Primary Mortgage Market Survey 30-year average was 7.40% and the MBA 30-year jumbo average 7.39%; a super jumbo on the same credit profile would typically price 12-37 bp above the lender's standard jumbo quote.
Relationship pricing erases most or all of the spread for HNW clients who bring wealth management assets to the same institution. A private bank client with $5M+ in invested assets at the lender's wealth arm can typically negotiate 25-75 basis points of concession on the super jumbo rate, fully offsetting the super jumbo premium and often pricing inside the lender's standard jumbo schedule. The headline rate is rarely the operative number for borrowers who can credibly threaten to move the wealth management relationship.
Reserves, DTI, and qualifying assets at the private bank desk
Private banks underwrite super jumbos against the whole client relationship, not just the loan file. The three qualifying tests, reserves, DTI, and asset verification, interlock in ways generic calculators do not capture.
Reserve tests run on a verified-asset basis
A private bank super jumbo desk verifies reserves through statements (typically two months of brokerage and bank statements at intake, with updated statements at closing). The qualifying balance is the lower of the average daily balance and the ending balance, with haircuts applied per asset class. A borrower with $400K in a money-market account, $1.2M in a diversified brokerage, and $800K in a 401(k) might present $2.4M of gross reserves but qualify with roughly $1.66M after haircuts ($400K cash at 100% + $1.2M brokerage at 70% + $800K retirement at 65%). On a 24-month reserve requirement of about $478K at 7.39%, the borrower clears with substantial cushion.
Income qualification mixes salary, RSU, and asset depletion
Most super jumbo borrowers do not qualify on W-2 salary alone. Private bank desks accept a two-year history of RSU vests, K-1 distributions with positive retained earnings tests, partnership income with operating-agreement support, and asset-depletion imputed income (typically 70% haircut on eligible assets divided by 360 months). For a borrower with $200K base salary, $150K averaged RSU vests over two years, and a $4M eligible portfolio producing $7,778 of monthly asset-depletion income, total qualifying monthly income runs roughly $45,000.
For the full asset-depletion math, including lender-specific haircut and divisor variations, see the asset depletion mortgage calculator spoke. Most super jumbo files combine traditional income documentation with asset depletion as a supplementary clearing mechanism, not as a substitute for income documentation.
Relationship-pricing concessions are the real lever
The published rate sheet at any private bank is the starting point, not the ending point. A super jumbo borrower with $5M+ in wealth management assets at the same institution typically negotiates 25-75 basis points of concession on the published rate. Bundling additional products (deposit account, credit card, business banking, trust services) can add another 10-25 basis points. The combined concession often brings the super jumbo rate inside the same lender's standard jumbo schedule, sometimes 50+ basis points below the headline super jumbo rate.
The negotiation lever is credible relationship mobility. A borrower with $5M at one private bank's wealth arm who can demonstrably move the relationship to a competitor has substantial pricing leverage. A borrower with no wealth assets at the lender, or whose wealth assets are locked in advisor relationships that would be costly to break, has materially less. The calculator's headline rate should be the negotiated all-in rate, not the published rate, for any meaningful comparison.
Worked example: $3M home, $2.4M super jumbo at 7.39%
Concrete numbers. This example assumes October 2026 pricing: a 7.64% published super jumbo rate (the 7.39% MBA jumbo average for the week of Oct 2, 2026 plus a 25 bp super jumbo premium), negotiated down to 7.39%. Buyer is a 44-year-old tech executive with:
- $3,000,000 home purchase, 20% down ($600K from cash and brokerage liquidation)
- $2,400,000 super jumbo, 30-year fixed at 7.39% (after Private Client concession from a 7.64% published rate)
- $5,000,000 taxable brokerage account at the lending bank's wealth arm (qualifies for relationship pricing)
- $1,200,000 in retirement accounts (counts at 65% for reserves)
- $400,000 in cash and money-market balances
- NY tax footprint: 35% federal + 9% state combined marginal rate (at $600K a year of gross income, a joint filer's taxable income falls in the 35% bracket, below the $768,700 where 37% starts)
- $50K monthly gross income (base salary plus two-year averaged RSU vests)
Reserve test
Monthly PITI on the $2.4M super jumbo at 7.39%, plus $34K annual property tax and $6K insurance: principal and interest of approximately $16,601 plus $3,333 monthly escrow = $19,934 monthly PITI. The private bank requires 18 months of PITI in liquid reserves (the bank's super jumbo standard for this tier), which is $358,813.
Verified reserves after haircuts: $400K cash at 100% ($400K) + $5M brokerage at 70% ($3.5M) + $1.2M retirement at 65% ($780K) = $4.68M qualifying. The borrower clears the reserve test by roughly 13x.
DTI test
Monthly PITI $19,934 + $2,500 other monthly debt = $22,434 against $50K gross income = 44.9% back-end DTI. That is outside the lender's 38-43% super jumbo band, so as structured this file does not qualify. The reserve cushion and the wealth management relationship might persuade a desk to stretch, but a buyer should not plan around an exception. Any one of these brings the file back inside 43%:
- Pay off the $2,500 of other monthly debt before applying. Back-end DTI falls to 39.9%.
- Put about $135,000 more down. A loan of roughly $2.265M brings the back-end ratio to 43%. This buyer's $400K of cash could cover it, at the cost of reserve cushion.
- Document more income. Qualifying income of about $52,200 a month clears 43% on the original loan.
Negotiating the rate is not a realistic fix on its own: the $2.4M loan only fits 43% at about 6.81%, well below the October 2026 market.
Rate concession
Published super jumbo rate at this lender on a $2.4M loan: 7.64%. Private Client concession for the $5M wealth management relationship: 25 basis points (to 7.39%). The borrower asks for an additional 10 basis points based on a credible competing quote from another private bank, the loan officer secures 5 basis points more, bringing the final rate to 7.34%. For the calculator example, we use 7.39% as the cleaner number.
After-tax effective rate math
Per IRS Publication 936, only the interest on the first $750K of acquisition indebtedness is deductible. On a $2.4M loan, that is 31.25% of the principal. Year-one interest at 7.39% on $2.4M is approximately $176,600. Deductible portion (interest on the first $750K, month by month as the balance amortizes): about $55,400. Non-deductible portion: about $121,200.
This example counts only the 35% federal benefit. A higher earner in the 37% bracket would not get more: OBBBA's new IRC §68 limit disallows 2/37 of the lesser of itemized deductions or taxable income above $768,700 (joint), so once taxable income clears that line by at least the itemized total, each deducted dollar is worth 35%. Whether the buyer's 9% state rate adds anything depends on whether the state allows a mortgage interest deduction on its own return; the SALT cap is a separate limit on deducting state taxes federally and does not change it. The federal savings on the deductible portion run approximately $55,400 × 35% = $19,400. Total after-tax interest cost: about $157,200. After-tax effective rate across the full $2.4M balance: $157,200 / $2.4M = 6.55%. The example also assumes the buyer itemizes; at this income the 2026 SALT deduction sits at its $10,000 floor, so the mortgage interest has to carry most of the itemized total past the $32,200 joint standard deduction.
A generic calculator applying the full 35% deduction to all interest would produce an after-tax effective rate of 7.39% × (1 - 0.35) = 4.80%. The 175-basis-point gap is the headline error that the super jumbo calculator corrects. For the deductible-vs-non-deductible interest split worked across HNW tax brackets, the dedicated after-tax spoke walks every variant.
When the rate premium erases the deduction advantage
Above $3M in loan size, the relationship between the super jumbo rate premium and the $750K deduction cap inverts. The deductible interest is fixed at the first $750K of principal regardless of loan size; the non-deductible interest grows linearly with loan size above the cap. At a $4M super jumbo at the 7.64% published rate, with the same 35% federal benefit, the deductible portion is 18.75% of the loan, and the after-tax effective rate across the full balance lands near 7.11%, only 53 basis points below the headline rate.
A portfolio-funded structure becomes competitive well before that. An SBLOC or pledged asset line is non-deductible, so it carries an after-tax effective rate identical to its headline rate (published rates on a $1M draw ran from 4.93% at Interactive Brokers Pro margin to 6.77% at Schwab Pledged Asset Line list price as of October 8, 2026), with the additional advantage of preserving the cost basis of the underlying portfolio. At a 7.39% mortgage and a 35% federal deduction value, the mortgage's year-one after-tax rate passes Fidelity's 6.22% line at a loan of about $1.7M and Schwab's 6.77% PAL list rate at about $3.3M; the 4.93-5.40% margin and promotional lines undercut it from roughly $0.8-1.0M. The SBLOC side is variable-rate and carries margin-call risk, so treat these crossovers as the point to start comparing, not a verdict. Running the super jumbo PITI in parallel with the SBLOC mortgage calculator and the PAL mortgage calculator is the operative comparison for loans above roughly $2M.
When a super jumbo is the wrong structure
A few profiles where the conventional super jumbo path does not fit and a different structure is correct.
Loan size above roughly $2M with substantial pledgeable portfolio. The deduction cap math erodes the after-tax advantage of the mortgage, and the reserve requirements consume cash that could be deployed elsewhere. A pledged asset line or piggyback structure (80% super jumbo plus 20% SBLOC) often produces a lower all-in cost. See the piggyback vs SBLOC calculator for the hybrid structure math.
W-2 income below the DTI threshold even with asset depletion layered in. If the combined documented income and asset-depletion imputed income still does not clear the 38-43% DTI band, the super jumbo is not approvable at any rate. The right structures are either a smaller loan with a larger down payment funded from portfolio assets, or a fully portfolio-funded purchase with no mortgage.
Sub-5-year expected hold. The amortization profile on a 30-year super jumbo means almost the entire monthly payment in years 1-5 is interest. For a buyer with a credible 3-5 year exit (relocation, upgrade, liquidity event), the ARM structure is materially cheaper. See the ARM vs fixed jumbo calculator for the break-even math.
Catastrophe-market property with insurance uncertainty. California wildfire zones, Florida hurricane corridors, and Texas hail belts have seen insurance premiums rise 30-100% since 2020. The true cost of ownership can exceed the headline PITI by tens of thousands of dollars annually. The reserve requirement at the super jumbo desk only captures part of this. The true cost of homeownership calculator surfaces the full carrying cost picture.
How to negotiate the super jumbo rate
A few concrete moves to bring the published rate down.
-
Consolidate wealth management assets at the lending institution before applying. Private Client tier at most major banks kicks in at $5M of invested assets and unlocks 25-50 basis points of automatic concession on super jumbo rates. The marginal cost of moving an additional brokerage account is usually trivial relative to the lifetime interest savings.
-
Get a competing quote from another private bank. Two written quotes give the loan officer something concrete to match. A $2.4M super jumbo at 25 basis points lower over 30 years saves roughly $147,000 in cumulative interest at a 7.39% starting rate; the lender has substantial room to negotiate when the alternative is losing the relationship.
-
Bundle deposit, credit, and trust services. Most private banks reserve their best rates for clients who bring multiple product lines. Adding a deposit relationship, business banking, or trust services to the wealth management mandate typically adds another 10-25 basis points of concession.
-
Time the application to the lender's relationship review cycle. Super jumbo desks have more pricing flexibility at the start of a quarter than at the end. Initiating the application right after a relationship review meeting tends to produce better terms than walking in cold at month-end.
-
Provide complete documentation upfront. Super jumbo files that arrive complete (two years of returns, vesting schedules, K-1s, brokerage statements, trust documents) tend to receive cleaner pricing because the underwriter can quote a confident rate rather than a defensive one. Incomplete files often get padded pricing.
The combined effect of these moves is typically 50-100 basis points off the published super jumbo rate. On a $2.4M loan at 7.39% over 30 years, 50 basis points is roughly $292,000 in cumulative interest savings.
When to consult a professional
The math in any super jumbo calculator is only as good as the inputs and the assumptions baked in. A calculator can produce a qualifying answer and an after-tax effective rate, but it cannot tell a borrower whether their specific RSU vesting schedule will count at a particular private bank's super jumbo desk, whether their trust structure affects the loan documentation, whether their state's homestead protections interact with the lender's underwriting, or whether their tax profile changes the deductibility analysis under AMT or NIIT.
For decisions above $1.25M in loan size, the calculator output is the starting point of a conversation with three professionals, not a substitute for it. A private bank super jumbo loan officer confirms what the lender will actually approve and at what all-in rate after relationship pricing. A CPA with HNW practice depth confirms the after-tax math against the buyer's specific return profile. A fiduciary financial advisor confirms whether the financing structure fits the broader balance sheet, the liquidity plan, and the reserve requirements that the loan imposes on portfolio composition.
Stockstead publishes educational content and runs calculators that model the comparisons. Stockstead does not provide investment, tax, or legal advice. For the full disclosure on what the site is and is not, see the disclaimers page.
Sources and further reading
- Federal Housing Finance Agency — Conforming Loan Limits
- Fannie Mae — 2026 Loan Limits
- IRS Publication 936 — Home Mortgage Interest Deduction
- Freddie Mac — Primary Mortgage Market Survey
- Consumer Financial Protection Bureau — Qualified Mortgage Rule
- Federal Reserve Bank of New York — SOFR Reference Rates
Market rates as of October 8, 2026; worked-example rates are dated October 2026 inputs; limits and tax thresholds are the 2026 figures. Conforming loan limits update each November, private bank super jumbo schedules change quarterly, mortgage rates move daily, and tax thresholds change with legislation. Verify directly with primary sources before sizing a loan. Educational, not financial advice. Stockstead publishes educational content for HNW home buyers and is not a licensed financial advisor, tax advisor, or mortgage broker. Consult a fiduciary advisor, a CPA, and a licensed loan officer before committing to any super jumbo financing structure.
Frequently asked questions
- What loan size triggers super jumbo pricing in 2026?
The threshold is lender-specific, not statutory. Most private bank and portfolio jumbo desks define super jumbo as loans above $1.25M, $1.5M, or $2M, depending on their internal risk and pricing tiers. There is no FHFA or industry-standard cutoff. The 2026 baseline conforming limit is $832,750, the high-cost ceiling is $1,249,125, and anything above the applicable county limit is technically a jumbo. The super jumbo label is an internal pricing convention that triggers tighter reserves, narrower lender pools, and rate tier adjustments.
- How much in reserves does a super jumbo lender require?
Typical private bank super jumbo reserve requirements run 12-24 months of PITI in verified liquid assets, compared to 6-18 months for a standard jumbo and roughly 2 months for a conforming loan. For a $2.4M super jumbo at 7.39% (the MBA jumbo average for the week of Oct 2, 2026) with $40K a year of property tax and insurance, monthly PITI is about $19,934, so that is roughly $239,000-$478,000 in cash or near-cash reserves the borrower must demonstrate post-closing. Some lenders accept 60-70% of brokerage balances toward the reserve test; others require true cash or money-market balances.
- Does a super jumbo carry a higher rate than a regular jumbo?
Usually yes, but the spread is narrow and lender-specific. Most private banks price super jumbos within 12-37 basis points of their standard jumbo rate, with the premium reflecting the narrower investor pool for these loans and the typical lack of agency or securitization exit. Relationship-pricing concessions can fully offset the super jumbo premium for clients who bring meaningful wealth management assets to the same institution. The headline rate is rarely the operative number for this loan size.
- Why do generic jumbo calculators fail on loans above $1.25M?
Generic jumbo calculators apply a single rate tier and a single reserve assumption across the full jumbo band. Above roughly $1.25M, lenders shift to a different underwriting model: portfolio-balance-sheet pricing rather than securitization-driven pricing, tighter DTI bands of 38-43% rather than the conforming 45-50%, and reserves measured in years rather than months. A calculator that does not adjust the reserve test, the DTI ceiling, and the rate tier at the super jumbo threshold produces qualification answers that the actual underwriter will not approve.
- What is the after-tax math on a $2.4M super jumbo?
Per IRS Publication 936, only the interest attributable to the first $750,000 of acquisition indebtedness is deductible on post-2017 mortgages, a cap the One Big Beautiful Bill Act made permanent. On a $2.4M loan, that is 31.25% of principal generating deductible interest. At a 7.39% headline rate (October 2026) and counting only the 35% federal benefit of the worked example's borrower, the blended after-tax effective rate across the full balance is about 6.55%, not the 4.80% a calculator would produce by applying the full deduction. The 175 basis-point gap reshapes any cash-vs-mortgage comparison.
- Should super jumbo borrowers compare against a portfolio-funded structure?
Yes, and at a lower loan size than the old $3M rule of thumb. At a 7.39% jumbo rate (October 2026) and a 35% federal deduction value (the 35% bracket, or the 37% bracket after OBBBA's limit on itemized deductions), the year-one after-tax rate on the mortgage rises above Fidelity's published 6.22% $1M SBLOC rate once the loan passes about $1.7M, and above Schwab's 6.77% PAL list rate past about $3.3M. The cheapest published lines, Interactive Brokers margin at 4.93% and a 5.40% Morgan Stanley fixed promotion, undercut it from about $0.8M to $1.0M. Those SBLOC rates are variable (except the promotion) and carry margin-call risk, so rate alone does not settle it. Run the super jumbo PITI in parallel with a portfolio-funded calculator and reconcile the after-tax cumulative cost over your actual hold horizon.
- Are super jumbos available outside private banks in 2026?
Yes, but the pool is narrow. A handful of non-bank lenders, credit unions with wealth management arms, and regional banks with portfolio capacity write super jumbos against their own balance sheet. The terms are typically less negotiable than at a private bank, and relationship-pricing concessions are minimal because the lender is not cross-selling wealth management services. For borrowers without an existing private bank relationship, comparing two non-bank super jumbo quotes against one private bank quote is the practical floor for a meaningful negotiation.
Ready to run the numbers on your situation?
Open the calculator →Related posts
SBLOC Mortgage Calculator: After-Tax vs Jumbo for HNW Buyers
SBLOC mortgage calculator for HNW buyers: after-tax math, the $750K deduction cap, a worked $2.4M portfolio-funded vs jumbo comparison, and rates as of October 8, 2026.
Jumbo Mortgage Calculator: 2026 Limits, PITI, and HNW Math
2026 jumbo mortgage calculator: $832,750 baseline threshold, $1,249,125 high-cost ceiling, PITI math, and how jumbo DTI qualifying differs from conforming.
Jumbo Mortgages for HNW Buyers: When Banks Still Win
SBLOC is not always the answer. For many HNW home purchases, especially loans near the $750K deduction cap, a jumbo at the right bank is cheaper, safer, and cleaner.