15 vs 30 Year Mortgage Calculator: HNW Tax-Bracket Math
By Tyler Singletary · · Updated · in Decision frameworks
The standard 15-vs-30 mortgage calculator answers the wrong question for high net worth buyers. It compares lifetime nominal interest, the 15-year wins, and reports the difference as if that were the whole story. For a buyer in the 32-37% federal bracket plus state tax, with a $2M+ jumbo and a real opportunity cost on cash flow, the right comparison is after-tax wealth at the hold horizon. That comparison changes the answer, though not always in the direction HNW advice assumes. Above the $750K acquisition-indebtedness cap, the extra principal a 30-year leaves outstanding is non-deductible, so it costs the full 30-year rate. The cash flow the 30-year frees has to earn more than that, after tax, to come out ahead. At 2026 jumbo rates, a typical 6.5% after-tax portfolio return does not. This post walks through the actual math.
For the broader context on why generic mortgage calculators fail HNW buyers, see the mortgage calculator for high net worth buyers pillar.
Market rates on this page are as of October 8, 2026. The worked example uses a 7.39% 30-year jumbo (the MBA average for the week of Oct 2, 2026), an assumed 6.75% jumbo 15-year (no weekly jumbo 15-year series is published; the Freddie Mac conforming 15-year was 6.73% on Oct 8, 2026), and an assumed 6.5% after-tax investment return. Freddie Mac PMMS averages and jumbo desk schedules move daily. Verify any rate quote directly with primary sources (linked at the bottom) and at least three jumbo lenders before committing.
Why Standard 15-vs-30 Calculators Mislead HNW Buyers
As of October 8, 2026, the Freddie Mac Primary Mortgage Market Survey showed the 30-year fixed at 7.40% and the 15-year fixed at 6.73%; the 15-year has typically run 50-75 basis points below the 30-year. A standard calculator multiplies that spread across the loan balance and produces a "lifetime interest savings" number that looks decisive: choose the 15-year and save hundreds of thousands. For a W-2 buyer with a conforming loan and no investable cash buffer, that math is roughly right.
For HNW buyers, three structural assumptions inside the standard calculator quietly break. First, the calculator assumes the full mortgage interest is deductible at the buyer's marginal rate. Per IRS Publication 936, deductible acquisition indebtedness caps at $750,000 for post-2017 mortgages, a cap the One Big Beautiful Bill Act made permanent. On a $2.4M jumbo, only 31.25% of the balance generates deductible interest. The headline tax-savings line on a standard calculator overstates the actual deduction by roughly 70%.
Second, the calculator treats the 15-year's higher payment as cost-free cash flow. For a high earner, that payment differential is investable. The 30-year's lower payment frees $5K-$15K per month that could compound in a taxable brokerage account at the buyer's expected after-tax return. The standard calculator never models the alternative use of those dollars.
Third, the calculator ignores the after-tax effective rate. A 7.39% headline rate is not what a 37%-bracket buyer in a 9% state actually pays after the deductible portion of interest reduces their tax bill. The after-tax effective rate on the full balance, blending the deductible $750K portion with the non-deductible remainder, runs roughly 100-150 basis points below the headline rate for high-bracket buyers above the cap. That blended rate is the right hurdle for a mortgage-vs-cash decision. As the next section shows, it is the wrong hurdle for 15 vs 30.
For the deeper essay on how the deduction cap reshapes HNW mortgage math, see the mortgage interest deduction cap explainer.
The Real Math: After-Tax Rate Spread on a Jumbo
Take a representative HNW jumbo: $2.4M loan on a $3M home. This example assumes 7.39% on the 30-year (the MBA jumbo average for the week of Oct 2, 2026) and an assumed 6.75% on the 15-year, a 64 basis point spread. The buyer is a joint filer whose taxable income sits in the 37% federal bracket (above the $768,700 where it starts in 2026) by more than their itemized deductions, plus 9% state, in a state that allows the mortgage interest deduction on its own return. Under the One Big Beautiful Bill Act's new IRC §68 limit, a 37%-bracket filer loses 2/37 of the lesser of their itemized deductions or their taxable income above that threshold, so each deducted dollar is worth 35% federally, not 37%; the combined rate on deductible interest is 44%. The example also assumes the buyer already itemizes: with income far above the $505,000 MAGI where the 2026 SALT cap starts phasing down, the SALT deduction sits at its $10,000 floor, and charitable gifts plus that floor already exceed the 2026 joint standard deduction of $32,200. If they do not, the effective tax shield is smaller than shown.
Year-One Interest by Term
On the 30-year at 7.39%, year-one interest is approximately $176,600. The deductible portion (interest attributable to the first $750K of principal) is roughly $55,400. The 44% combined rate produces a tax shield of roughly $24,400. The after-tax cost of year-one interest is about $152,200.
On the 15-year at 6.75%, year-one interest is approximately $159,100. Deductible portion: roughly $50,600 (less because the rate is lower). Tax shield: roughly $22,300. After-tax cost of year-one interest is about $136,800.
The 15-year saves roughly $15,400 in after-tax interest in year one. But the 15-year's monthly payment is approximately $21,238 vs the 30-year's $16,601, a payment differential of $4,637 per month or $55,645 per year. The 15-year buyer pays about $40,200 more in net cash flow in year one, and every dollar of it goes to accelerated principal reduction.
That accelerated principal is not free money. It is cash flow that could have been invested. The question is what that cash would have to earn.
The Hurdle Is the Non-Deductible Rate, Not the Blended Rate
The blended after-tax effective rate on the full balance is about 6.34% on the 30-year ($152,200 divided by $2.4M) and about 5.70% on the 15-year. It is tempting to treat 6.34% as the hurdle: invest the freed cash at more than 6.34% after tax and the 30-year wins. That shortcut is wrong when the loan is above the cap.
Both loans start far above $750K, and the deductible slice is the same first $750K on each. What the 30-year adds is extra principal on top of that slice. Interest on that extra principal is non-deductible, so it costs the full 7.39%, and the 30-year also charges 64 bp more on the entire balance. The freed cash has to beat that, after tax.
Running the full month-by-month comparison bears this out. The annual after-tax return at which the two terms break even is about 10.8% over a 10-year horizon, 9.0% over 15 years, and 7.6% over 30 years. (The 30-year figure sits above the 7.39% note rate because mortgage interest compounds monthly: 7.39% a month at a time is about 7.65% a year.) A 6.5% after-tax expected return on a diversified taxable portfolio (roughly 8.5% pre-tax at a 24% blended LTCG-plus-qualified-dividend effective rate) clears none of them.
Worked Example: $2.4M Jumbo, 37%-Bracket + 9% State Buyer, Three Horizons
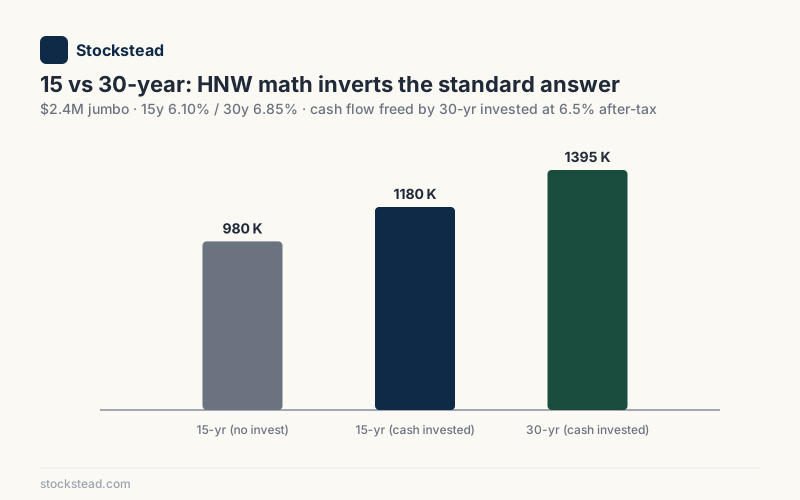
Concrete numbers across three horizons: 10 years, 15 years, and 30 years. Assumptions held constant: $2.4M loan, 7.39% on the 30-year, an assumed 6.75% on the 15-year (October 2026 inputs), 35% federal (the §68-limited value for a 37%-bracket filer) plus 9% state on the deductible slice, 6.5% after-tax return, no refi. Both buyers spend the same amount every month: the 15-year payment of $21,238. The 30-year buyer pays $16,601 and invests the $4,637 difference. Each buyer also invests their own tax savings, which arrive once a year as a refund. The 6.5% is an annual (effective) after-tax return. After the 15-year loan pays off, that buyer invests the full $21,238 every month. Home value is the same on both paths, so the comparison is investment portfolio minus remaining mortgage.
10-Year Horizon
After 120 months, the 30-year buyer still owes about $2.08M and holds an invested portfolio of about $1.10M. The 15-year buyer owes about $1.08M and holds about $301K (the invested tax savings). Net of the mortgage, the 15-year buyer is ahead by roughly $198,000.
15-Year Horizon (When the 15-Year Loan Pays Off)
At year 15, the 15-year buyer has zero remaining mortgage and about $503K invested. The 30-year buyer still owes about $1.80M against a portfolio of about $1.97M. The 15-year buyer leads by roughly $331,000. This is the point where the 15-year buyer's freed $21,238 monthly payment starts going into investments instead.
30-Year Horizon
At year 30, both loans are paid off. The 30-year buyer's portfolio is worth about $7.00M. The 15-year buyer, who invested the full $21,238 a month from year 15 onward, holds about $7.64M. The 15-year buyer leads by roughly $637,000.
That result assumes the 15-year buyer invests every dollar of the freed payment after payoff, a disciplined-saver assumption that empirically does not always hold. The math is very sensitive to it. If the 15-year buyer spends just 10% or more of that post-payoff payment, the 30-year comes out ahead at year 30. If they spend 30% ($6,371 a month), the 30-year buyer wins by roughly $1.27M.
The return assumption matters just as much. At an 8.5% after-tax return, the 30-year still trails at year 10 (by about $111K) and year 15 (by about $76K), but leads by about $666K at year 30.
The loan size matters most of all. Rerun the same model on a $750K loan, where every dollar of interest is deductible, and the 30-year wins at a 6.5% return at every horizon: by about $5K at year 10 and $336K at year 30, with a break-even after-tax return of only about 4.8-6.1%. The standard advice that the 30-year wins for disciplined investors is a below-the-cap result.
When the 15-Year Actually Wins
Above the cap, at 2026 jumbo rates, the 15-year is the default winner for a disciplined saver with a mid-single-digit after-tax return expectation. Several HNW profiles make that answer stronger.
Buyers Within 10-15 Years of Retirement
A 55-year-old buyer planning retirement at 65-67 has limited horizon to compound the cash flow differential, and the 10-year comparison above is the least favorable to the 30-year. If the buyer's portfolio is already shifting toward fixed income with lower expected returns, the gap widens further. The 15-year also delivers a mortgage-free retirement, which has real value for sequence-of-returns risk management.
Low-Tax-State Buyers
A Florida, Texas, or Nevada buyer faces a 37% federal rate with no state income tax. The tax shield on the deductible slice is smaller, so the after-tax cost of both loans sits closer to the headline rate. The 15-year's principal-reduction speed becomes relatively more attractive when the deduction shield is smaller. For the state-specific math, see the property tax mortgage calculator for HNW states spoke (the property-tax interaction also matters for the SALT cap conversation).
Buyers Who Will Not Actually Invest the Differential
Every 30-year-wins scenario assumes the 30-year buyer invests the cash flow differential. For buyers with high known consumption (private school tuition, multiple homes, lifestyle creep), the freed cash flow gets spent. Spent cash flow does not compound. The 15-year's forced savings mechanism, principal amortization is involuntary, beats the theoretical investment plan that does not happen.
When the 30-Year Still Wins
The 30-year comes out ahead when the loan is at or near the $750K cap, when the buyer credibly expects after-tax returns above the hurdle for their horizon, when the 15-year buyer would spend part of the payment freed at payoff, or when the lower required payment has real liquidity value (variable RSU or partnership income, a business that may need capital). It is a conditional answer, not a default one.
How This Interacts With Cash vs Mortgage and ARM Choices
The 15-vs-30 decision does not happen in isolation. For HNW buyers, it sits alongside two other structural questions that the mortgage vs cash purchase calculator and the ARM vs fixed jumbo calculator address.
The mortgage-vs-cash question asks whether to take any mortgage at all. If the buyer has $3M in cash and is considering a $3M home, the comparison is whether freed capital compounds at a higher after-tax return than the mortgage costs. The two analyses use different hurdles. Mortgage vs cash compares against the blended after-tax rate on the whole loan (about 6.3% in this post's example, or roughly 6.5% expressed as an annual return), because the whole loan is the difference between the two paths. Fifteen vs 30 compares against the cost of the extra principal the 30-year carries, which above the cap is non-deductible. So a buyer can rationally take a mortgage rather than pay cash and still choose the 15-year term. At a 6.5% after-tax return, this post's numbers put mortgage vs cash close to a wash while the 15-year clearly beats the 30-year.
The ARM-vs-fixed question asks whether to accept reset risk in exchange for a lower initial rate. For a buyer with a 5-7 year hold horizon (relocation, upgrade, sale at retirement), an ARM priced below the 30-year fixed can save meaningful money (as of October 8, 2026, the national 5/1 ARM average was 6.43% against a 7.40% 30-year fixed; 7/1 and 10/1 structures price closer to the fixed). The ARM analysis applies the same after-tax framework: discount the rate savings by the marginal tax bracket, model the reset risk against the expected hold horizon, compare to the fixed-rate alternative.
These three strategic comparisons share an input set: the buyer's combined marginal rate, the $750K cap utilization, the expected after-tax investment return, and the planned hold horizon. Running them in isolation produces inconsistent answers. The pillar's framework is that all three should be run together with a single set of assumptions for the buyer's actual situation.
The After-Tax Calculator That Feeds This Comparison
Per IRS Publication 936, the $750K cap on deductible acquisition indebtedness reshapes the after-tax effective rate calculation. The after-tax mortgage calculator spoke handles the conversion: take the headline rate, compute the deductible portion of interest (capped at $750K of principal), apply the combined federal and state marginal rate (only if the buyer itemizes; the SALT deduction is capped at $40,400 for 2026 and falls to a $10,000 floor at higher incomes), and produce an after-tax effective rate on the full loan balance.
For the 15-vs-30 comparison, run the after-tax calculator twice, once at the 30-year headline rate, once at the 15-year headline rate. Then run the wealth projection month by month: the 30-year cash flow differential invested at the buyer's expected after-tax return, versus the 15-year's accelerated principal reduction, which earns the after-tax rate on the marginal principal. Above the cap, that marginal rate is the full non-deductible rate, not the blended one.
The math is mechanical once the after-tax rates are computed. The hard part is honest assumptions: the expected after-tax investment return is not the headline portfolio return, the cash flow differential gets partly consumed not fully invested, and the hold horizon may not match the loan term. Running the comparison with conservative assumptions on the investment side produces a more defensible answer than running it with aspirational returns.
When to Consult a Professional
The 15-vs-30 decision interacts with the buyer's full balance sheet, retirement timeline, risk tolerance, and tax situation in ways no calculator captures cleanly. The output of this analysis is a starting point for a conversation with three professionals.
A jumbo loan officer confirms the actual rate spread between 15-year and 30-year at the lender, which can differ from the Freddie Mac PMMS averages and varies by lender portfolio appetite. A CPA with HNW practice depth confirms the after-tax math against the buyer's specific return profile, including AMT exposure, state tax credits, the interaction with NIIT, and any state-specific deduction rules. A fiduciary financial advisor confirms that the chosen term and the planned investment strategy for the cash flow differential align with the broader financial plan and risk tolerance.
For loans above $1M, the calculator output is the conversation opener, not the answer. Stockstead publishes educational content and runs calculators that model the comparisons. Stockstead does not provide investment, tax, or legal advice. For the full disclosure on what the site is and is not, see the disclaimers page.
Sources and further reading
- Freddie Mac — Primary Mortgage Market Survey
- IRS Publication 936 — Home Mortgage Interest Deduction
- IRS Publication 550 — Investment Income and Expenses
- Federal Housing Finance Agency — Conforming Loan Limits
- Federal Reserve Bank of New York — SOFR Reference Rates
- Tax Foundation — State Individual Income Tax Rates
Market rates as of October 8, 2026; worked-example rates are dated October 2026 inputs (the 15-year jumbo rate is an assumption); tax thresholds are the 2026 figures. Mortgage rates move daily; tax thresholds change with new legislation. Verify directly with primary sources before sizing a loan. Educational, not financial advice. Stockstead publishes educational content for HNW home buyers and is not a licensed financial advisor, tax advisor, or mortgage broker. Consult a fiduciary advisor, a CPA, and a licensed loan officer before committing to a mortgage term.
Frequently asked questions
- Is a 15-year mortgage actually cheaper than a 30-year for HNW buyers?
On nominal lifetime interest, yes. On after-tax wealth, it depends on whether the loan is above the $750K acquisition cap from IRS Publication 936. Above the cap, the extra principal a 30-year leaves outstanding earns no deduction, so it costs the full 30-year rate. In this post's $2.4M example (a 7.39% 30-year vs an assumed 6.75% 15-year, October 2026), the 30-year only breaks even if the freed cash flow earns about 7.6% a year after tax over 30 years, or 9.0% over 15. At a 6.5% after-tax return, the 15-year buyer who keeps investing after payoff ends up about $637K ahead. For a loan at or under the cap, the answer reverses and the 30-year wins at the same 6.5% return.
- What rate spread should I assume between 15 and 30 year jumbos?
The Freddie Mac PMMS shows a typical 50-75 basis point spread between conforming 15-year and 30-year fixed rates. Jumbo spreads run similar, sometimes wider in stressed credit environments. As of October 8, 2026, the Freddie Mac PMMS averages were 7.40% for the 30-year fixed and 6.73% for the 15-year, and the MBA 30-year jumbo average was 7.39%. This post's worked example assumes a 64 bp jumbo spread: 7.39% on the 30-year (the MBA jumbo average for the week of Oct 2, 2026) and an assumed 6.75% on the 15-year, since no weekly jumbo 15-year series is published. Always pull live quotes from at least three jumbo desks before committing — the spread varies materially across lenders based on their portfolio appetite.
- Does the mortgage interest deduction change the 15 vs 30 decision?
Yes, but above the cap it works against the 30-year more than for it. Per IRS Publication 936, only the interest on the first $750,000 of acquisition indebtedness is deductible, and the One Big Beautiful Bill Act made that cap permanent. On a $2.4M jumbo, that is 31.25% of the balance. The 30-year keeps a deductible interest stream alive longer, but the extra balance it carries sits above the cap, so the interest on it earns no deduction. In this post's example, the 30-year's year-one tax shield is only about $2,100 larger than the 15-year's, while its year-one interest is about $17,500 higher. For loans at or under the cap, every dollar of interest is deductible, and the 30-year looks much better.
- When does the 15-year actually win for HNW buyers?
More often than the standard HNW advice suggests. At October 2026 jumbo rates and a loan well above the $750K cap, the 15-year wins on after-tax wealth for a buyer who keeps investing once the loan is paid off and expects less than about 7.6% a year after tax over 30 years. It also fits buyers who will not invest the 30-year's freed cash flow and buyers within 10-15 years of retirement. The 30-year still wins when the loan is at or under the cap, when expected after-tax returns clear the hurdle, or when the 15-year buyer would spend more than a small share of the payment freed at payoff.
- What if I take a 30-year and pay it like a 15-year anyway?
This is a worse outcome than just taking the 15-year on the rate side, you pay the 30-year rate premium (50-75 bp higher). It is a better outcome on flexibility, you can stop the accelerated payments in any month without renegotiating. For HNW buyers with variable income (RSU vests, partnership distributions), the optionality is worth real money. The cleanest path is a 30-year at the higher rate with a documented investment plan for the freed cash flow, not an informal acceleration scheme.
- Does the calculator account for state tax differences?
Most generic 15-vs-30 calculators do not. The after-tax effective rate depends on the combined federal plus state marginal rate, and the state piece exists only if your state allows a mortgage interest deduction on its own return. The SALT cap is a separate limit on deducting state and local taxes federally. Under the One Big Beautiful Bill Act it is $40,400 for 2026, reduced by 30% of MAGI above $505,000 to a $10,000 floor, and it reverts to $10,000 in 2030. Most buyers in this bracket sit at the floor, which mainly decides whether itemizing beats the $32,200 joint standard deduction. A 37% federal plus 9% state California buyer faces different after-tax math than a 37% federal plus 0% state Florida buyer. Run the comparison with your actual combined marginal rate.
- How does this interact with refinancing risk?
The 30-year preserves optionality to refi if rates fall. The 15-year locks in the lower rate but commits the buyer to higher principal payments for the full term. If rates drop 100+ basis points within five years, the 30-year buyer can refi into a new 30-year or step down to a 15-year at the new lower rate. The 15-year buyer can also refi but has less spread to work with. In a rising-rate environment, the 30-year's lower payment is the conservative posture.
Ready to run the numbers on your situation?
Open the calculator →Related posts
Property Tax Mortgage Calculator: HNW High-Tax State Math
Property tax mortgage calculator for HNW buyers in CA, NY, NJ, MA, FL: $3M worked examples and how the 2026 SALT cap phase-down hits after-tax cost.
Piggyback vs SBLOC Calculator: HNW Hybrid Down-Payment Math
HNW piggyback calculator: 80% jumbo + 20% SBLOC vs 80/10/10, with worked numbers on a $2M home and 7-year cumulative cost across three down-payment paths.
Mortgage Calculator for High Net Worth: Complete 2026 Guide
HNW mortgage calculator guide: jumbo PITI above $832,750, asset depletion income, after-tax rates under the $750K cap, and SBLOC vs. mortgage comparisons.