After-Tax Mortgage Calculator: True Net Cost of Your Payment
By Tyler Singletary · · Updated · in Tax & deductions
Most online mortgage calculators show a "tax savings" line that assumes the buyer deducts every dollar of interest at their marginal rate. For a salaried HNW buyer with a $2.4M jumbo on a primary residence in California, that line is wrong by tens of thousands of dollars a year. The IRS caps deductible acquisition indebtedness at $750,000 under IRC Section 163(h)(3) per IRS Publication 936, a limit the One Big Beautiful Bill Act of 2025 made permanent. The same law raised the SALT cap to $40,400 for 2026 but phases it back down to $10,000 for households with modified AGI above about $606,000, which covers almost every buyer in the top bracket. The after-tax effective rate a high earner actually pays on a jumbo is rarely the number a generic calculator returns. This guide walks through the math, the inputs that matter, and a worked example: a 37% federal plus 9% state buyer with a $2.4M jumbo at 7.39% (the MBA 30-year jumbo average for the week of Oct 2, 2026) pays about 6.35% after tax over the first five years if they already itemize, and about 6.7% if SALT is their only other deduction. A generic calculator would show 3.99%. That 230-plus basis point gap reshapes every downstream financing decision. For the wider HNW calculator stack this tool sits inside, see the pillar guide on mortgage calculators for high net worth buyers.
Market rates cited as current are as of October 8, 2026. The worked example assumes a 7.39% jumbo, the MBA average for the week of Oct 2, 2026, and its figures are fixed at that rate. Tax figures reflect the One Big Beautiful Bill Act (signed July 4, 2025) and 2026 IRS inflation adjustments, as of October 11, 2026. The $750,000 acquisition cap is permanent and not indexed. The SALT cap is $40,400 for 2026, rises 1% a year, phases down above $505,000 of MAGI, and reverts to $10,000 in 2030. Verify any rate or tax threshold with primary sources before sizing a loan or running a comparison.
What an After-Tax Mortgage Calculator Actually Computes
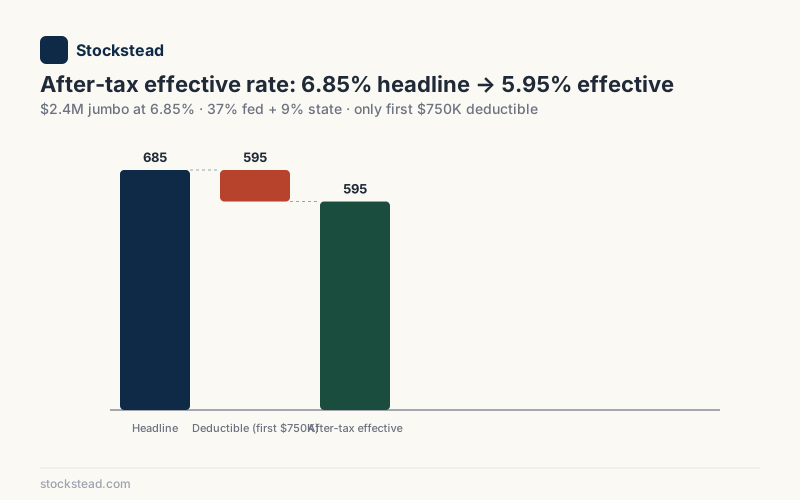
An after-tax mortgage calculator converts a headline mortgage rate into the effective rate a borrower pays after applying the home mortgage interest deduction, subject to the statutory caps. For HNW buyers above the $750K acquisition-indebtedness ceiling, the math collapses to a four-input formula: total interest, deductible fraction, marginal tax rate, and effective spread between the deductible and the non-deductible portions. The output is a single after-tax effective rate, comparable across financing structures.
The conversion has three layers. Layer one is the deductibility fraction. Per IRS Publication 936, interest on a post-2017 acquisition mortgage is deductible only on the first $750,000 of principal ($375,000 if married filing separately). For pre-December-15-2017 mortgages, the cap is $1,000,000 under the grandfather rule. A $2.4M jumbo at 7.39% generates about $176,600 of year-one interest; only 750,000 divided by 2,400,000, or 31.25%, of that interest is potentially deductible at origination.
Layer two is the marginal rate that applies to the deductible portion. For high earners, the federal marginal rate is 32%, 35%, or 37% depending on bracket, plus state marginal rate (which ranges from 0% in Texas and Florida to 13.3% in California for the top bracket per the Tax Foundation's 2026 state income tax rate data). For filers in the 37% bracket (joint taxable income above $768,700, or $640,600 single), the One Big Beautiful Bill Act's new IRC Section 68 limit cuts itemized deductions by 2/37 starting in 2026, so each deductible dollar is worth 35% federally, not 37%. The combined rate is the marginal value of a deductible dollar.
Layer three is the SALT cap and standard-deduction interaction. The SALT cap bundles state income tax with property tax, and since 2025 its size depends on income: $40,400 for 2026 below $505,000 of MAGI, shrinking to a $10,000 floor by about $606,333. For a top-bracket California or New York buyer, state income tax fills the $10,000 floor on its own, so incremental property tax has zero federal value, and the small SALT deduction makes it harder for mortgage interest to clear the $32,200 joint standard deduction. State tax savings on the deductible mortgage interest itself depend on the buyer's state itemization rules, since many high-tax states allow a separate state-level mortgage interest deduction that does not flow through the SALT cap. The full layered calculation is the difference between a usable after-tax rate and a marketing-tier estimate.
Why Generic Calculators Get the After-Tax Number Wrong
Per IRS Publication 936, the home mortgage interest deduction caps acquisition indebtedness at $750,000 for any mortgage originated after December 15, 2017. The cap has never been indexed for inflation, and the One Big Beautiful Bill Act made it permanent rather than letting it revert to $1M after 2025. Generic calculators built before 2018, and many built since, apply the marginal tax rate to the entire interest payment. On the $2.4M worked example, that single failure means roughly 70% of the calculator's year-one "tax savings" is not real.
The Bankrate and Zillow Failure Mode
The standard online calculator architecture takes loan amount, rate, term, and a marginal tax rate, then computes monthly principal and interest, total interest over the life of the loan, and an estimated tax savings equal to total interest multiplied by the marginal rate. The math is correct for a mortgage at or below $750,000 of acquisition indebtedness where the buyer itemizes. It is wrong for any mortgage above the cap, and it is wrong for any buyer whose capped SALT plus mortgage interest barely clears the standard deduction.
For a $2.4M jumbo at 7.39% over 30 years, total interest is approximately $3.58M. A generic calculator applied to a 37% federal plus 9% state combined rate returns $1.65M of total tax savings. The actual deductible interest, capped at $750K of principal, is approximately $1.55M across the life of the loan, and the actual tax savings, at 44% once the Section 68 limit trims the federal rate to 35%, is approximately $682K. The generic calculator overstates the lifetime tax benefit by roughly $963K, or 141%. If SALT is the buyer's only other itemized deduction, the real lifetime savings fall to about $436K.
The SALT Cap Layer That Most Tools Skip
The SALT cap is the second structural error. Per the Congressional Research Service overview of the SALT cap, the 2017 Tax Cuts and Jobs Act bundled property tax, state and local income tax, and certain other taxes into a single $10,000 ceiling for itemized deduction purposes. The One Big Beautiful Bill Act (signed July 4, 2025) raised that ceiling to $40,000 for 2025 and $40,400 for 2026, rising 1% a year, then reverting to $10,000 in 2030. The catch for HNW buyers is the phase-down: the cap shrinks by 30% of modified AGI above $505,000 and bottoms out at $10,000 at about $606,333 of MAGI.
That splits high earners in two. A household with $250K to $505K of MAGI, a common range for tech employees in a normal vesting year, gets the full $40,400, which can cover state income tax and a real slice of property tax. A household in the 37% bracket, which starts above $768K of joint taxable income for 2026, is past the floor by construction and is effectively still under the old $10,000 cap. In between, each extra dollar of MAGI from $505K to about $606K removes 30 cents of deduction, which adds about 9.6 points to the effective federal marginal rate in the 32% bracket and about 10.5 points in the 35% bracket. A large RSU vest can move a household across that band in a single year.
The downstream effect on mortgage math for a top-bracket buyer: the property tax line on the home, which generic calculators frequently roll into a "tax-deductible" bucket, produces zero incremental federal deduction, because state income tax alone fills the $10,000 floor. On a $3M California home with about $35,400 of property tax, that is roughly $13,100 a year of "missing" federal deduction value at 37% compared to a calculator that deducts it in full.
Why the Itemization Threshold Matters
The 2017 Act also nearly doubled the standard deduction, and the 2025 law made the larger amount permanent: $32,200 for joint filers and $16,100 for single filers in 2026. For a buyer whose itemizable deductions, mortgage interest plus capped SALT plus charitable giving, fall below the standard deduction, the after-tax effective rate on the mortgage equals the headline rate.
The bigger effect for HNW buyers is partial. A top-bracket couple whose SALT is stuck at the $10,000 floor and who has no other itemized deductions only starts to benefit after deductible mortgage interest covers the $22,200 gap to the standard deduction, plus about $1,840 more because the Section 68 limit also trims the itemized total, about $24,040 in all. That costs $8,414 a year of federal savings. An honest after-tax calculator checks itemization first and counts only the deduction above the standard deduction. Most generic tools assume itemization without checking.
The Math: Headline Rate to After-Tax Effective Rate
The conversion from headline to after-tax effective rate follows a deterministic five-step calculation. Each step applies a statutory or buyer-specific input. For a buyer with $L of loan, a headline rate $r$, a deductibility cap $C$ (either $750K or $1M depending on origination date), a combined marginal tax rate $t$, and the gap between the standard deduction and the buyer's other itemized deductions, the formula is straightforward. The figures below assume a 7.39% jumbo, the MBA average for the week of Oct 2, 2026.
Step One: Compute Total Annual Interest
Year-one interest on an amortizing loan equals the average outstanding balance over the year multiplied by the rate. For most practical purposes, year-one interest closely approximates loan amount multiplied by rate. For a $2.4M loan at 7.39%, rate times balance gives $177,360; the standard 30-year amortization schedule gives $176,605, because the balance falls by about $20,000 during the year. The rest of this example uses $176,605.
Step Two: Apply the Deductibility Fraction
The deductible fraction equals the lesser of $1$ or $C / L$. For a $2.4M loan with a $750K cap, the fraction is $750,000 / 2,400,000 = 0.3125$ at origination, and about 31.4% across year one as the balance pays down. Deductible year-one interest is about $55,425. Non-deductible year-one interest is about $121,180.
Step Three: Apply the Combined Marginal Rate
The marginal value of a deductible dollar equals the federal rate plus the state rate (for buyers in states with a state-level mortgage interest deduction that does not flow through the SALT cap). For a 37% federal plus 9% state buyer who already itemizes (for example, because charitable giving plus SALT already exceeds the standard deduction), the combined rate is 44%: 35% federal after the Section 68 limit plus 9% state. Year-one tax savings equal $55,425 \times 0.44 = $24,387$. State-specific itemization rules vary: California allows a state-level mortgage interest deduction separate from the SALT cap, while some states do not. The calculator must apply the correct combined rate based on state-by-state itemization rules.
Step Four: Compute the After-Tax Effective Rate
After-tax annual interest cost equals total interest minus tax savings: $176,605 - $24,387 = $152,218$. After-tax effective rate equals after-tax interest divided by the year's average balance (about $2.39M): 6.37% in year one. The gap between 6.37% and the headline 7.39% is the actual after-tax benefit, about 102 basis points, not the 340 basis points a generic calculator would imply.
The same framework applied without the $750K cap or the Section 68 limit, which is what a generic calculator does, would produce a deductible fraction of 1.0, year-one tax savings of $176,605 \times 0.46 = $81,238$, and an after-tax effective rate of 3.99%. That 3.99% figure understates the real cost by 238 basis points.
Step Five: Check the Standard Deduction
A buyer in the 37% bracket has SALT stuck at the $10,000 floor. If that is their only other itemized deduction, the Section 68 limit means the itemized total must reach about $34,040 before it beats the $32,200 joint standard deduction, so the first $24,040 of deductible interest only replaces it. Federal savings become $0.35 \times (10,000 + 55,425) - 0.37 \times 32,200 = $10,985$, plus $4,988 of state savings at 9%, for $15,973 in total. The year-one after-tax rate rises to 6.72%. This calculator-output gap, 273 basis points against the generic 3.99%, is exactly what reshapes the financing decision.
A Worked Example: $2.4M Jumbo at 7.39%, NY HNW Buyer
For a high-bracket buyer in a high-tax state, the after-tax rate gap is the largest. Per the Federal Housing Finance Agency, the baseline conforming loan limit is $832,750 ($1,249,125 in high-cost counties), so a $2.4M loan is firmly in jumbo territory. This example assumes a 7.39% jumbo, the MBA 30-year jumbo average for the week of Oct 2, 2026; every figure below is fixed at that rate. The method is the same at any rate, but every dollar figure scales with the rate you plug in.
The Buyer Profile
- 42-year-old NY-based tech executive, married filing jointly
- $3M home purchase, 20% down ($600K), $2.4M jumbo at 7.39% fixed 30-year
- 37% federal marginal rate (top bracket: joint taxable income above $768,700), 6.85% NY state marginal rate (NY's bracket for joint taxable income from roughly $323K to $2.155M)
- Combined marginal rate on deductible mortgage interest: 41.85% (37% federal cut to 35% by the Section 68 limit, + 6.85% state, ignoring the small NIIT effect on the marginal dollar since it does not apply to deductions)
- MAGI well above $606,333, so the SALT cap is at its $10,000 floor, and state income tax alone fills it
- $30K annual property tax on the home, producing no federal deduction because the $10,000 SALT floor is already full
The Headline Versus After-Tax Comparison
Year-one numbers. The last column applies the standard-deduction check from Step Five for a buyer whose only other itemized deduction is the $10,000 of SALT.
| Line item | Generic calculator | Capped, already itemizing | Capped, SALT-only itemizer |
|---|---|---|---|
| Year-one interest | $176,605 | $176,605 | $176,605 |
| Deductible fraction | 100% | 31.4% | 31.4% |
| Deductible interest | $176,605 | $55,425 | $55,425 |
| Combined marginal rate applied | 43.85% | 41.85% | 41.85% (federal only above the standard deduction) |
| Year-one tax savings | $77,441 | $23,195 | $14,781 |
| After-tax annual interest cost | $99,163 | $153,409 | $161,823 |
| After-tax effective rate (year one) | 4.15% | 6.42% | 6.77% |
The generic calculator returns 4.15%. The after-tax calculator with the $750K cap and the Section 68 limit returns 6.42%, or 6.77% once the standard deduction is respected. The gap is 227 to 262 basis points. Over the full life of the loan, the generic calculator overstates the cumulative tax benefit by roughly $920K even for a buyer who already itemizes.
The 37% + 9% Version Used in the Introduction
The figure quoted in the introduction uses a 37% federal plus 9% state buyer (44% combined after the Section 68 limit) and averages the first five years, which is the decision-relevant window for a 5-10 year hold:
- Year-one interest: $176,605
- Deductible portion: $55,425 (31.4% of total)
- Tax savings, already itemizing: $55,425 × 0.44 = $24,387
- After-tax interest: $176,605 - $24,387 = $152,218
- After-tax effective rate, year one: 6.37%
- Average over years 1-5: 6.35% (6.71% for a SALT-only itemizer)
- Average over years 1-10: 6.31% (6.68% for a SALT-only itemizer)
The five-year average of about 6.35% is the practical number for the cash vs mortgage comparison. Use the higher SALT-only figure if your SALT is at the $10,000 floor and you do not otherwise itemize.
How the Rate Changes Over Time
The after-tax effective rate is not static over a 30-year mortgage, and above the cap it falls rather than rises. As principal amortizes, interest falls in proportion to the balance, but the $750K cap stays fixed, so the deductible share of interest grows. For the 37% plus 9% buyer who already itemizes, the rate moves from 6.37% in year one to 6.23% in year ten, 6.06% in year fifteen (deductible share 40.8% on an average balance of about $1.84M), and 5.71% in year twenty. The balance drops below $750K during year 26, after which all interest is deductible and the rate approaches 4.14%. For a SALT-only itemizer the path is flatter, 6.72% to 6.29% by year twenty, and it rises again in the final years when interest no longer clears the standard deduction. A static single-rate output is an approximation; a full amortization-aware calculator returns a vector of annual after-tax rates.
How the After-Tax Rate Reshapes Downstream Decisions
The after-tax effective rate is the input variable for every other HNW financing decision. Per Freddie Mac's Primary Mortgage Market Survey, the 30-year fixed average was 7.40% as of October 8, 2026, with the jumbo 30-year average at 7.39%. A buyer using the headline rate to compare against an expected portfolio return systematically misjudges the comparison. A buyer using the wrong after-tax rate (uncapped) makes the inverse error. Both produce financing decisions worth six-figure deltas over a typical hold horizon.
Cash vs Mortgage: The Spread That Decides It
The cash vs mortgage comparison hinges on the spread between the after-tax mortgage rate and the expected after-tax portfolio return. At the worked example's 7.39% jumbo (the MBA average for the week of Oct 2, 2026), the 10-year blended after-tax rate is about 6.31% for a 37% plus 9% buyer who already itemizes, only about 19 basis points below a 6.5% after-tax portfolio return. Stockstead's 10-year model of the $2.4M decision, which accounts for amortization and the once-a-year timing of tax savings, puts break-even at an after-tax return of about 6.54%. At 6.5% the mortgage path finishes about $11K behind, still a wash on a $2.4M decision; at 7.5% it is about $300K ahead, and at 5.5% it is about $293K behind. For a SALT-only itemizer, break-even rises to about 6.92%. Below break-even, cash wins unless raising the cash would trigger a large capital-gains bill. The full comparison, including that cap-gains drag, sits in the mortgage vs cash purchase calculator spoke.
If the buyer had instead used the generic-calculator after-tax rate of 3.99%, the apparent spread against a 6.5% return would be about 250 basis points. The buyer would conclude the mortgage path is clearly better when, at today's rates, it is close to a coin flip on the rate spread alone.
15-Year vs 30-Year Math With the Cap
The 15-year vs 30-year decision interacts directly with the $750K cap. The 15-year amortizes principal faster, so the loan balance crosses below $750K sooner, at which point the deductible fraction rises to 100% for the remaining years. The 30-year keeps the balance above $750K for roughly 24-26 years of the loan depending on starting balance. The cumulative deductibility math actually favors the 30-year early on (more deductible interest in absolute terms) and the 15-year later (full deductibility for the back half). For the full after-tax comparison across HNW tax brackets, see the 15 vs 30 year mortgage calculator spoke.
Portfolio-Funded Alternatives
For SBLOC and PAL-funded alternatives, interest is generally non-deductible as home acquisition indebtedness under IRC Section 163(h)(3) because the loan is secured by the portfolio rather than the home. Per IRS Publication 550, SBLOC interest can sometimes be deductible as investment interest under IRC Section 163(d) if traced to investment use, but that does not apply to a home-purchase use case without sophisticated structuring. The comparison now depends on the lender. Against the worked example's 7.39% jumbo, which blends to about 6.31% after tax over ten years for a 37% plus 9% buyer who already itemizes, the $1M-draw SBLOC quotes of Oct 8, 2026 compare like this: Interactive Brokers Pro at 4.93% is about 138 basis points cheaper, Morgan Stanley's 5.40% fixed promotional rate is about 91 basis points cheaper, Fidelity at 6.22% is effectively a tie (9 basis points cheaper), and Schwab's 6.77% PAL list rate is about 46 basis points more expensive. For a SALT-only itemizer (6.68% blended), Fidelity comes out about 46 basis points cheaper. The comparison is sharper at the margin: above the $750K cap each extra jumbo dollar costs the full 7.39%, which is more than every SBLOC quote above. What the SBLOC rate does not price in is that it floats with SOFR (Morgan Stanley's fixed promo aside) and carries margin-call risk, while the jumbo is fixed for 30 years. Current quotes as of October 8, 2026: jumbo 7.39%, SBLOC 4.93% (IBKR Pro) to 6.77% (Schwab PAL list).
True Cost: The Lines a PITI Calculator Skips
The after-tax mortgage rate addresses only the interest line. True cost of ownership for an HNW buyer includes the carrying costs that fall outside PITI: HOA in luxury condo buildings ($30K-$120K annually in major metros), maintenance reserves of 1-1.5% of home value per year, insurance shocks in catastrophe markets, and capital improvements over a typical 7-10 year hold. For the full HNW carrying-cost math beyond after-tax interest, see the true cost of homeownership calculator spoke.
Property Tax and the SALT Interaction
Property tax for a HNW buyer in California, New York, or New Jersey can run $25K-$80K annually on a $3M-$5M home. For a buyer above about $606,333 of MAGI, the SALT cap is at its $10,000 floor and state income tax fills it, so the property tax line produces zero incremental federal deduction. Below $505,000 of MAGI, the $40,400 cap can leave room for part of the property tax bill, so run the SALT math at your actual income. The state-level deduction value depends on state itemization rules. California, for example, allows a separate state-level deduction for property tax outside the SALT-capped federal calculation, so there is some state-level recovery.
The after-tax calculator should treat property tax as fully non-deductible at the federal level for buyers at the SALT floor and apply only the state-level deduction value where state rules permit. Most generic calculators bundle property tax into the "deductible" line, which overstates the after-tax benefit by another $7K-$15K annually for HNW buyers in high-tax states. The state-by-state math sits in the property tax mortgage calculator for HNW states spoke.
Insurance, Maintenance, and Capital Improvements
The non-tax-deductible carrying costs are typically 1-3% of home value annually for HNW homes. On a $3M California home in a wildfire-exposed area, insurance alone has risen to $15K-$40K per year per most state insurance department reports, with several major carriers withdrawing from the market entirely since 2023. Maintenance reserves at 1% of home value add $30K. Capital improvements over a 10-year hold typically run another 0.5-1% per year on average. The total non-interest carrying cost can equal or exceed the after-tax interest cost itself.
How to Use This Calculator Alongside the Rest of the Stack
The after-tax mortgage calculator is one of four calculator categories an HNW buyer needs to run before committing to a financing structure. The other three: loan-type calculators (jumbo, super jumbo, asset depletion) that determine qualification and base pricing; portfolio-funded calculators (SBLOC, PAL, piggyback) that model alternative structures; and strategic comparison calculators (cash vs mortgage, 15v30, ARM vs fixed) that compare paths side by side. The after-tax tool provides the cost-of-capital input that every comparison calculator needs.
Recommended Order of Operations
- Run the jumbo PITI calculator first to establish the base case headline payment and qualifying ratios.
- Run the after-tax calculator (this tool) to convert the headline rate into the decision-relevant after-tax effective rate.
- Run the true cost calculator to add HOA, maintenance, insurance, and capital improvements to get the full carrying cost.
- Run the strategic comparison calculator (cash vs mortgage, 15v30, ARM vs fixed) using the after-tax effective rate as the input.
Skipping the after-tax step is the single most common HNW calculator error. The headline rate is a marketing number; the after-tax rate is the decision number. For the wider after-tax framework that informs HNW mortgage strategy, the existing essay on the mortgage interest deduction cap and HNW math is the companion read, and the down-payment-side counterpart sits in capital gains tax on home down payments.
What to Hand Your CPA
The calculator output is the starting point of a conversation with a CPA, not a substitute for one. The numbers a CPA will refine: where your MAGI lands against the SALT phase-down (especially in a heavy RSU-vest year), AMT exposure (which can change the marginal value of the deduction), state-level itemization rules that vary by state, the interaction with Net Investment Income Tax for buyers with significant investment income, and the specific tracing rules for SBLOC interest under IRC Section 163(d). The calculator gives you a defensible ballpark; the CPA gives you the filing-ready number.
When to Consult a Professional
The after-tax mortgage calculation is sensitive to inputs that only the buyer's CPA can confirm. AMT exposure can affect the marginal value of the deduction for high earners with significant preference items. State itemization rules vary materially: California, New York, and Massachusetts each handle the mortgage interest deduction differently at the state level. The interaction with charitable bunching strategies, where a buyer concentrates several years of giving into one tax year to clear the standard deduction, changes whether itemization is even useful in a given year.
For decisions above $1M in loan size, run the calculator output past a CPA before committing to the structure. A jumbo loan officer can confirm the rate and qualifying. A CPA confirms the after-tax math against the buyer's specific return profile, including AMT, state credits, NIIT interaction, and tracing rules for any portfolio-secured financing layer. A fiduciary financial advisor confirms whether the financing structure fits the broader balance sheet and liquidity plan.
Stockstead publishes educational content and runs calculators that model the comparisons. Stockstead is not a licensed financial advisor, tax advisor, or mortgage broker. For the full disclosure on what the site is and is not, see the disclaimers page.
Sources and further reading
- IRS Publication 936 — Home Mortgage Interest Deduction
- IRS Publication 550 — Investment Income and Expenses
- Federal Housing Finance Agency — Conforming Loan Limits
- Freddie Mac — Primary Mortgage Market Survey
- Federal Reserve Bank of New York — SOFR Reference Rates
- Tax Foundation — State Individual Income Tax Rates 2026
- Congressional Research Service — The SALT Cap
Market rates cited as current are as of October 8, 2026; the worked example is fixed at a 7.39% jumbo, the MBA average for the week of Oct 2, 2026. Limits and tax thresholds as of October 11, 2026. The $750,000 acquisition-indebtedness cap is permanent and not indexed. The SALT cap is $40,400 for 2026, phases down to $10,000 above $505,000 of MAGI, and reverts to $10,000 in 2030; verify any tax-law treatment with primary IRS sources or a CPA before relying on calculator output. Educational, not financial advice. Stockstead publishes educational content for HNW home buyers and is not a licensed financial advisor, tax advisor, or mortgage broker. Consult a fiduciary advisor, a CPA, and a licensed loan officer before committing to any financing structure.
Frequently asked questions
- What is an after-tax mortgage calculator?
An after-tax mortgage calculator converts a headline mortgage rate into the effective rate a borrower actually pays after applying the home mortgage interest deduction. For high earners, the calculation must respect the $750K acquisition-indebtedness cap from IRC Section 163(h)(3), which the One Big Beautiful Bill Act of 2025 made permanent, the SALT cap and its income phase-down, and whether the buyer clears the standard deduction at all. The output is a single after-tax effective rate that can be compared directly against alternative financing structures (cash, SBLOC, PAL) and against expected after-tax investment returns.
- Why does a generic mortgage calculator overstate tax savings for HNW buyers?
Generic calculators typically apply the buyer's marginal rate to the entire annual interest payment. For mortgages above $750,000 in acquisition indebtedness (the IRC Section 163(h)(3) cap per IRS Publication 936), only the portion of interest attributable to the first $750K of principal is deductible. On a $2.4M jumbo, that means only roughly 31% of total interest in year one is deductible, not 100%. In the worked example (a 7.39% jumbo, 37% federal plus 9% state), about 70% of a generic calculator's year-one 'tax savings' line is not real, and closer to 80% if SALT is the buyer's only other itemized deduction.
- How do I calculate the after-tax effective rate on a jumbo mortgage?
Four steps. First, multiply year-one interest by the deductible fraction (750,000 divided by total acquisition indebtedness). Second, multiply the deductible portion by the buyer's combined federal plus state marginal rate, counting 35% rather than 37% federal in the top bracket because of the 2026 IRC Section 68 limit on itemized deductions. Third, check the standard deduction: if SALT is stuck at the $10,000 floor and there are no other itemized deductions, the first $24,040 or so of deductible interest only replaces the 2026 joint standard deduction and saves nothing federally. Fourth, subtract the tax savings from total interest and divide by the loan balance. For a 37% federal plus 9% state buyer with a $2.4M loan at 7.39% (the MBA jumbo average for the week of Oct 2, 2026), the result is about 6.4% for a buyer who already itemizes and about 6.7% for one whose only other deduction is SALT, not the 3.99% a generic calculator implies.
- Does the after-tax calculator need to account for the SALT cap?
Yes, and the One Big Beautiful Bill Act (signed July 4, 2025) made the SALT input income-dependent. The cap bundling state income, property, and local taxes is $40,400 for 2026, but it shrinks by 30% of modified AGI above $505,000 down to a $10,000 floor, which it reaches at about $606,333 of MAGI. It reverts to $10,000 for everyone in 2030. A household earning $250K to $505K can now deduct a meaningful slice of property tax. A top-bracket buyer in California, New York, or New Jersey is at the floor, state income tax alone fills it, and property tax on the financed home produces no incremental federal deduction. The SALT floor also matters for the mortgage itself, because it decides whether the buyer clears the standard deduction.
- What inputs does an after-tax mortgage calculator require?
Nine inputs at minimum: loan amount, headline rate, loan term, federal marginal tax rate, state marginal tax rate, modified AGI (it sets the SALT cap), filing status (joint vs single affects the standard deduction, and married filing separately halves the acquisition cap), whether the mortgage was originated before or after December 15, 2017 (changes the cap from $1M to $750K), other acquisition indebtedness on a second home (which shares the same cap), and SALT room already consumed by state income tax. Missing any of these produces a misleading after-tax rate.
- How does the after-tax rate change over the life of a 30-year mortgage?
Above the cap, it falls. The $750K cap is fixed while the balance shrinks, so the deductible share of each year's interest rises as principal pays down. On a $2.4M jumbo at 7.39% for a 37% federal plus 9% state buyer who already itemizes, the after-tax rate is 6.37% in year one, 6.23% in year ten, 6.06% in year fifteen, and 5.71% in year twenty. The balance drops below $750K during year 26, after which every dollar is deductible and the rate bottoms out near 4.14%. The absolute tax benefit stays roughly flat while the balance is above the cap; what changes is the share of interest it covers. If SALT is the buyer's only other deduction, the last few years can tip back toward the standard deduction and the rate rises again.
- How is the after-tax mortgage rate used in a cash vs mortgage decision?
The after-tax effective rate is the cost-of-capital input on the mortgage side. Compare it directly against the expected after-tax return on the cash that would otherwise fund the purchase. In the worked example (a 7.39% jumbo, the MBA average for the week of Oct 2, 2026), the 10-year blended after-tax rate is about 6.31% for a buyer who already itemizes and 6.68% if SALT is the only other deduction. In Stockstead's 10-year model, the mortgage path breaks even with cash at an after-tax portfolio return of about 6.54% (6.92% for the SALT-only buyer). Above that, the mortgage path builds wealth. Below it, cash wins on expected value, before the cap-gains cost of raising the cash and subject to liquidity preference and risk tolerance.
Ready to run the numbers on your situation?
Open the calculator →Related posts
True Cost of Homeownership Calculator: Beyond PITI
HNW true cost of homeownership calculator: luxury HOA, maintenance reserves, catastrophe insurance, and capital improvements that PITI misses on a $3M home.
Property Tax Mortgage Calculator: HNW High-Tax State Math
Property tax mortgage calculator for HNW buyers in CA, NY, NJ, MA, FL: $3M worked examples and how the 2026 SALT cap phase-down hits after-tax cost.
Piggyback vs SBLOC Calculator: HNW Hybrid Down-Payment Math
HNW piggyback calculator: 80% jumbo + 20% SBLOC vs 80/10/10, with worked numbers on a $2M home and 7-year cumulative cost across three down-payment paths.