Mortgage vs Cash Purchase Calculator: 2026 Opportunity Cost
By Tyler Singletary · · Updated · in Decision frameworks
The mortgage-versus-cash question for a high net worth buyer is not a vibe. It is an opportunity-cost calculation with five inputs that all matter and one tax adjustment that most calculators omit. The buyer who has $3M in cash and is staring at a $3M home can pay outright or take a jumbo and invest the difference. The right answer depends on the after-tax effective rate on the loan, the expected after-tax return on the alternative investment, the hold horizon, the cap-gains drag if the cash purchase requires any liquidation, and the buyer's tolerance for the structural risks of leverage during a drawdown.
This post is the calculator-focused companion to the existing essay on the true opportunity cost of a down payment, which walks through a single 30-year case study. The framing here is different: how to model the comparison, what inputs to gather, what assumptions to test, and where the standard cash-vs-mortgage calculator from a bank or a generic real-estate site quietly misleads HNW buyers. For the broader calculator stack an HNW buyer needs, see the pillar guide on mortgage calculators for high net worth buyers.
Market rates cited as current are as of October 8, 2026. The worked examples assume a 7.39% jumbo, the MBA 30-year jumbo average for the week of Oct 2, 2026, and their figures are fixed at that rate. Tax treatment reflects the One Big Beautiful Bill Act (signed July 4, 2025) as of October 11, 2026. The Freddie Mac PMMS 30-year average, SOFR, and Treasury yields move daily. Verify rates with primary sources before sizing a loan or running a comparison.
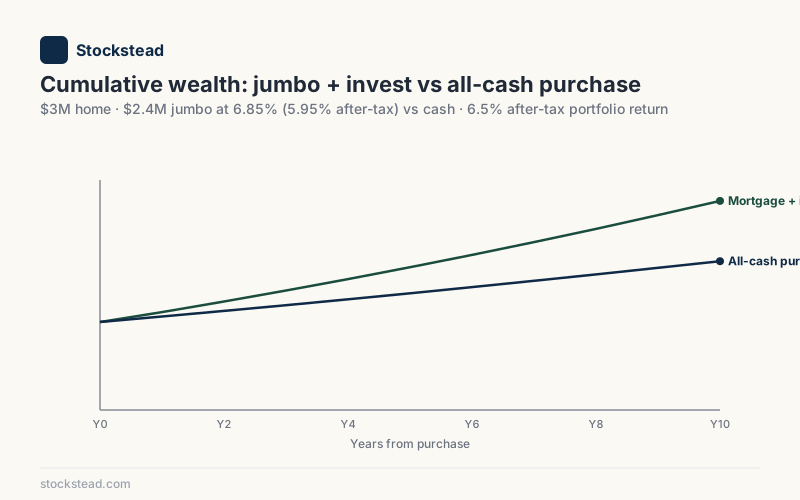
Why the mortgage vs cash decision changed as rates rose
As of October 8, 2026, the Freddie Mac Primary Mortgage Market Survey 30-year average was 7.40% and the jumbo 30-year average was 7.39%; your lender's jumbo quote can sit above or below conforming. The Fed's target range was 3.75–4.00%, which anchors short-term Treasury bill yields, and the 10-year Treasury yield is published daily by the U.S. Treasury. Mortgage rates, short-term yields, and long-term yields together set the cash-versus-mortgage calculus for an HNW buyer.
The 2020-2022 environment, with 30-year fixed rates near 3% and Treasury yields under 1%, made the mortgage path obvious. Borrow at 3%, invest at an expected 7%, capture the 400 bp spread. At the 7.39% jumbo this post's examples assume (the MBA average for the week of Oct 2, 2026), a top-bracket buyer's after-tax mortgage rate is about 6.31% to 6.68%, which is roughly the same as the 6.0-6.5% after-tax return a diversified portfolio is usually assumed to earn. The spread runs from about +19 basis points to about -68 basis points depending on the buyer's deductions and return assumption. On the rate spread alone, the mortgage path no longer typically wins. It is close to a wash, and the answer now turns on two other inputs: the capital-gains bill that paying cash would trigger, and the return you honestly expect.
What a mortgage vs cash purchase calculator needs to model
A correctly built mortgage-vs-cash calculator takes seven inputs and produces a single output: the cumulative wealth differential between the two paths over the hold horizon. The seven inputs are home price, down payment, mortgage rate and term, expected portfolio return, marginal federal and state tax brackets, cost basis on any cash that would need to be liquidated, and hold horizon. The output is dollars of additional wealth from the mortgage path minus the cash path, evaluated at the end of the hold.
The seven inputs in detail
Home price and down payment. These determine the loan size. For a $3M home with 20% down, the loan is $2.4M. The down payment funding source matters separately because of cost basis.
Mortgage rate and term. This post's worked example assumes a 30-year fixed jumbo at 7.39%, the MBA average for the week of Oct 2, 2026. The jumbo 30-year average was 7.39% as of October 8, 2026, but use your lender's actual quote. The calculator needs the term to compute amortization and the deductible interest schedule year by year.
Expected portfolio return. This is the most consequential and most debated input. For a 70/30 stock-bond portfolio, a 7-8% nominal expected return is within the range of long-run historical realized returns and most institutional capital market assumptions. After tax, that becomes 6.0-6.5% for a high-bracket buyer in a taxable account, accounting for dividend taxation and turnover drag.
Marginal federal and state tax brackets, and MAGI. A 37% federal plus 9% state buyer is the canonical HNW case for California or New York. For filers in the 37% bracket (joint taxable income above $768,700, or $640,600 single), the One Big Beautiful Bill Act's new IRC Section 68 limit cuts itemized deductions by 2/37 starting in 2026, so each deductible dollar of mortgage interest is worth 35% federally, not 37%. The bracket determines both the deductible value of mortgage interest and the after-tax compounded return on the alternative investment. MAGI matters separately since 2025: the SALT cap is $40,400 for 2026 below $505,000 of MAGI but phases down to $10,000 by about $606,333, so a top-bracket buyer has only $10,000 of SALT and may need charitable giving to clear the $32,200 joint standard deduction before mortgage interest saves anything.
Cost basis on liquidated cash. If the cash for a cash purchase comes from a taxable brokerage account, the calculator must compute the realized capital gain at sale. A 50% blended cost basis on a $3M cash purchase produces a $1.5M realized gain, which at a 20% federal LTCG plus 3.8% NIIT per the IRS NIIT guidance plus 9% state, generates roughly $492K of tax due. That tax is a real cost of the cash path that the mortgage path avoids.
Hold horizon. The number of years before sale, refinance, or payoff. The mortgage's compounding spread advantage scales with hold length.
How to compute the after-tax effective mortgage rate
For a 37% federal plus 9% state buyer with a $2.4M jumbo at 7.39% (the MBA average for the week of Oct 2, 2026), the after-tax effective rate is about 6.4%, not the 3.99% implied by applying the full marginal rate against the full interest payment. The gap exists because of the $750K acquisition-indebtedness cap from IRC Section 163(h)(3) per IRS Publication 936. Only the first $750K of principal generates deductible interest. On a $2.4M loan, that is 31.25% of the balance.
The mechanic in four steps. First, compute year-one interest on the full loan from the amortization schedule: about $176,600. Second, compute the deductible portion, the interest on the first $750K of principal: about $55,400. Third, apply the buyer's 44% combined marginal rate (35% federal after the Section 68 limit, plus 9% state) to the deductible portion only: about $24,400 of tax savings, for an after-tax interest cost of about $152,200, or 6.37% of the year's average balance. Fourth, check the standard deduction. A top-bracket buyer's SALT is at the $10,000 floor, so if that is their only other itemized deduction, the first $24,000 or so of deductible interest just replaces the standard deduction, savings fall to about $16,000, and the year-one rate rises to 6.72%. Blended over ten years as the balance amortizes, the after-tax rate is about 6.31% for a buyer who already itemizes and 6.68% for the SALT-only buyer.
The conversion with full SALT-cap and state-bracket inputs is worked natively in the after-tax spoke. For the deeper essay on how the deduction cap reshapes HNW mortgage math, see the mortgage interest deduction cap explainer.
What expected after-tax portfolio return should you use?
In 2026, a 70/30 diversified portfolio's expected after-tax return for a high-bracket buyer in a taxable account lands in the 6.0-6.5% range. That figure derives from a 7.5-8.0% nominal expected return (equity risk premium plus the current 10-year Treasury yield, weighted 70/30) minus tax drag from dividends, distributions, and turnover. A buyer running the cash-vs-mortgage comparison should test the calculator across at least three return assumptions, not commit to a single point estimate.
The scenarios below use an equal-cash-flow model on the $2.4M loan decision, assuming a 7.39% jumbo (the MBA average for the week of Oct 2, 2026). The mortgage buyer keeps $2.4M invested and pays the $16,601 monthly principal and interest from income, reinvesting the annual tax savings. The cash buyer has no payment and invests the same $16,601 each month instead. Both portfolios compound monthly at the after-tax return, and the mortgage path's wealth is its portfolio minus the remaining loan balance. The home is the same in both paths, and the figures assume the cash is genuinely idle cash, so there is no capital-gains drag. The buyer is 37% federal plus 9% state and already itemizes.
Three return scenarios to test
Conservative. 5.5% after-tax. Reflects a slightly more bond-heavy allocation, a lower equity-risk-premium assumption, or higher friction costs. Against a 6.31% blended after-tax mortgage rate, the spread is about -81 basis points, and the cash path finishes about $293K ahead after 10 years.
Base case. 6.5% after-tax. Reflects standard 70/30 capital market assumptions from major asset managers. The spread looks like about +19 basis points, but the mortgage compounds monthly and the tax savings arrive once a year, which together cost about 20 basis points. After 10 years the mortgage path is about $11K behind, which is a wash on a $2.4M decision.
Optimistic. 7.5% after-tax. Reflects either a higher equity allocation, a more bullish equity-risk-premium view, or a buyer with access to tax-efficient structures (direct indexing, ETF-only allocation) that reduce drag. The spread widens to about +119 basis points, and the mortgage path finishes about $300K ahead after 10 years.
Break-even sits at an after-tax return of about 6.54% over 10 years. For a top-bracket buyer whose only other itemized deduction is $10,000 of SALT, the mortgage is more expensive after tax and break-even rises to about 6.92%; at the 6.5% base case, that buyer's cash path is about $125K ahead.
The three scenarios above are not academic. They span the realistic range of after-tax outcomes for HNW buyers in a diversified taxable portfolio in 2026. At a 7.39% jumbo, the base case sits almost exactly on the break-even line, so the answer flips within the range of reasonable assumptions. The decision quality improves substantially when the buyer runs all three and asks: what is my honest probability that my after-tax return clears about 6.5%?
How to model the cap-gains drag on a cash purchase
If the cash for an all-cash purchase comes from a taxable brokerage account rather than cash savings, the realized capital gain on liquidation is a real cost that must be added to the cash-purchase column. Per IRS Topic No. 409, long-term capital gains for high-income filers are taxed at 20% federal, plus the 3.8% NIIT, plus the applicable state rate. For a California or New York buyer, that is a combined 32-33% on the realized gain.
The size of the drag scales with cost basis. At a 32.8% combined rate (20% federal, 3.8% NIIT, 9% state), a $3M liquidation at a 25% blended basis (highly appreciated long-held positions) produces a $2.25M realized gain and roughly $738K of tax. The same liquidation at an 80% basis (recently bought, modest appreciation) produces a $600K gain and roughly $197K of tax. The drag can shift the cash-vs-mortgage answer by hundreds of thousands of dollars depending on basis.
Most calculators we've seen, including the bank-provided cash-vs-mortgage tools, omit the cap-gains drag entirely. They treat the cash as if it appeared from nowhere. For a buyer who has been accumulating in a taxable account for 15-20 years, the realized gain at liquidation is often the single largest line item in the cash-purchase column, exceeding the cumulative interest on the alternative mortgage by a wide margin. For the deeper essay on this specific failure mode, see the existing post on liquidating investments for a down payment.
A worked $3M decision at a 7.39% jumbo
Concrete numbers. This example assumes a 7.39% jumbo, the MBA 30-year jumbo average for the week of Oct 2, 2026, and a 6.5% after-tax portfolio return, the base case where the rate spread alone is a wash. The buyer has a $4M taxable brokerage account with a 50% blended cost basis, is purchasing a $3M home in a 37% federal plus 9% state jurisdiction, and already itemizes. Capital gains are taxed at 32.8% combined. The hold horizon is 10 years, and the model is the same equal-cash-flow model as the scenarios above. The two paths under comparison:
Path A: All-cash purchase. Netting $3M after tax at a 50% basis means selling about $3.59M of the portfolio and paying about $589K of capital-gains tax. About $411K stays invested. With no mortgage payment, the buyer invests the $16,601 a month the mortgage path would have paid. After 10 years, the portfolio is worth about $3.54M.
Path B: $2.4M jumbo at 7.39%, $600K down. Netting the $600K down payment means selling about $718K and paying about $118K of tax. About $3.28M stays invested at 6.5% after-tax, and the annual mortgage-interest tax savings are reinvested. After 10 years, the portfolio is worth about $6.49M and the loan balance is about $2.08M. Over those ten years the buyer pays about $1.43M of after-tax interest and retires about $322K of principal, all from income.
The wealth comparison at year 10. Path A has the home and about $3.54M of investments. Path B has the home, about $6.49M of investments, and $2.08M of remaining mortgage, for about $4.41M of net investments. The mortgage path is ahead by roughly $873K before tax on unrealized gains.
Almost all of that lead comes from capital-gains tax deferral, not from the rate spread. Path A pays about $471K more tax up front, and that $471K compounds to about $884K over ten years at 6.5%, slightly more than the entire gap. Path B still owes the deferred tax if the portfolio is ever sold: if the gains that were embedded at purchase are taxed at year 10, the lead shrinks to about $402K. For a SALT-only itemizer, the lead is about $759K before that tax and about $288K after it.
The mortgage path wins this worked example, but because the cash would have come from appreciated stock, not because borrowing at 7.39% beats a 6.5% return. The win narrows if the portfolio return underperforms, if the buyer's cost basis is higher (less cap-gains drag in the cash path), or if the buyer will sell the portfolio soon anyway. It widens if rates fall and the buyer refinances, or if the appreciated positions are held until a step-up in basis.
When the cash purchase wins
The mortgage path does not always win. Five conditions tilt the math toward cash:
- Very high cost basis on the cash side. If the cash is genuinely cash savings (or post-tax bonus money, or recently realized gain) with near-zero embedded tax cost, the cash-purchase path avoids the friction that usually penalizes it.
- Low expected portfolio return. A buyer who would park the freed cash in money-market funds at a hypothetical 4.5% nominal, not a 70/30 portfolio, faces an after-tax alternative return of roughly 2.4%, well below any plausible mortgage rate. The mortgage path loses. At a 7.39% jumbo, even a diversified portfolio has to clear about 6.5% after tax for the mortgage to win on the spread alone.
- Short hold horizon. Under a 5-year hold, the closing costs and origination fees on the jumbo can outweigh the modest opportunity-cost gain, especially if the buyer expects to sell or refinance.
- Low risk tolerance during a drawdown. The mortgage path leaves the buyer holding the portfolio through any market event. A 40% portfolio drawdown coupled with a mandatory mortgage payment from cash flow can force liquidation at the bottom. The cash buyer faces no such forcing event.
- Liquidity preference and behavioral factors. Some buyers genuinely sleep better debt-free. That preference has value even if it does not show up on the calculator's output.
How an SBLOC reframes the cash vs mortgage question
For HNW buyers with substantial taxable brokerage assets, the cash-vs-mortgage binary is incomplete. A third path exists: keep the cash invested, take a smaller jumbo, and bridge any gap with a portfolio-secured line that does not trigger liquidation. Per FINRA's Securities-Backed Lines of Credit Investor Alert, SBLOCs are widely available at major brokerages, with rates priced as a spread over SOFR per the New York Fed reference rate.
The SBLOC path eliminates the cap-gains drag of the cash-purchase path while keeping the deductible portion of the jumbo. The non-deductibility of SBLOC interest is the offsetting cost. Modeling all three paths in parallel, cash, jumbo only, jumbo plus SBLOC, is what the SBLOC mortgage calculator spoke does. For the deeper essay on the three-way comparison, the existing SBLOC vs mortgage vs cash post is the companion read. Stockstead also operates an interactive after-tax SBLOC vs HELOC calculator for the portfolio-funded vs home-equity decision specifically.
How this calculator connects to the rest of the HNW stack
The cash-vs-mortgage decision is the strategic comparison that sits on top of the rest of the HNW calculator stack. Its inputs depend on the outputs of three other calculators in the cluster, and its answer changes when any of those upstream inputs change.
The mortgage rate input comes from the jumbo or super-jumbo pricing your specific lender quotes, modeled in the loan-type calculators. The after-tax effective rate conversion comes from the after-tax math discussed above. The 15-versus-30-year decision sits adjacent: a shorter amortization changes the cumulative interest cost on the mortgage side and the freed-cash-flow input on the investment side. For that comparison, see the 15 vs 30 year mortgage calculator for HNW buyers. The ARM-versus-fixed decision sits below: an ARM priced under the fixed jumbo (as of October 8, 2026, the 5/1 ARM average was 6.43% against 7.39% for the 30-year jumbo) changes the mortgage-side cost meaningfully, but introduces reset risk that depends on hold horizon. See the ARM vs fixed jumbo mortgage calculator for the break-even math.
The honest answer to the cash-versus-mortgage question requires running all four of these calculators together. The mortgage-versus-cash output is a single number, but it is built from the outputs of the loan-type, after-tax, term-comparison, and rate-structure calculators. The buyer who runs only the mortgage-vs-cash tool and treats the headline rate as the input is solving the wrong problem.
When to consult a professional
A calculator can produce a wealth differential to the nearest dollar. It cannot tell a buyer whether their specific tax facts support claiming the mortgage interest deduction at the size and structure modeled, whether their state's intersection with the SALT cap actually delivers the assumed deductible value, whether their portfolio return assumption is reasonable given their actual asset allocation, or whether their cost-basis figure on any liquidated cash is accurate down to the lot.
For decisions of this magnitude, the calculator output is the start of a conversation with three professionals: a CPA with HNW practice depth to confirm the after-tax math against the buyer's specific return, a fiduciary financial advisor to confirm the expected portfolio return assumption and the risk tolerance for any leveraged path, and a jumbo loan officer to confirm what rate and structure the lender will actually approve.
Stockstead publishes educational content and runs calculators that model these comparisons. Stockstead does not provide investment, tax, or legal advice. For the full disclosure, see the disclaimers page.
Sources and further reading
- Freddie Mac — Primary Mortgage Market Survey
- Federal Reserve Bank of New York — SOFR Reference Rates
- U.S. Department of the Treasury — Daily Treasury Par Yield Curve Rates
- IRS Publication 936 — Home Mortgage Interest Deduction
- IRS Topic No. 409 — Capital Gains and Losses
- IRS — Net Investment Income Tax (NIIT)
- Federal Housing Finance Agency — Conforming Loan Limits
- FINRA — Securities-Backed Lines of Credit (Investor Alert)
Market rates cited as current are as of October 8, 2026; worked-example rates are illustrative inputs. Mortgage rates, Treasury yields, and SOFR move daily; tax thresholds change with new legislation. Verify directly with primary sources before sizing a loan or making a financing decision. Educational, not financial advice. Stockstead publishes educational content for HNW home buyers and is not a licensed financial advisor, tax advisor, or mortgage broker. Consult a fiduciary advisor, a CPA, and a licensed loan officer before committing to any financing structure.
Frequently asked questions
- Is it better to buy a house with cash or get a mortgage in 2026?
At today's jumbo rates, it is close to a wash on the rate spread alone, and the answer usually turns on whether paying cash would force you to sell appreciated stock. The mortgage wins when the after-tax effective rate on the loan is below the expected after-tax portfolio return on the cash that would otherwise be deployed. A 7.39% jumbo (the MBA average for the week of Oct 2, 2026) works out to about 6.31% after tax over ten years for a 37% federal plus 9% state buyer above the $750K deduction cap who already itemizes, and about 6.68% if SALT at the $10,000 floor is their only other deduction. In Stockstead's 10-year model, break-even is an after-tax portfolio return of about 6.54% (6.92% for the SALT-only buyer), just above the 6.0-6.5% range a 70/30 portfolio is typically assumed to earn. If the cash would come from selling low-basis stock, the deferred capital-gains tax usually tips the answer to the mortgage. If it is idle cash, it is a coin flip that depends on your return assumption.
- What is the opportunity cost of buying a house in cash?
The opportunity cost is the after-tax return the cash would have earned over the hold horizon, minus the after-tax cost of the mortgage that the cash purchase avoided. On a $2.4M decision at a 7.39% jumbo with a 7% after-tax portfolio return, the mortgage path finishes about $141K ahead after ten years for a buyer who already itemizes, or about $24K ahead if SALT is their only other deduction, before any cap-gains drag on the cash side. At a 6.5% return the mortgage path is about $11K behind, a wash on a $2.4M decision, and at 5.5% cash is about $293K ahead. The number is sensitive to the assumed portfolio return, the hold horizon, and the buyer's marginal tax brackets.
- How do I calculate the after-tax effective mortgage rate?
Start with the headline rate. Compute the deductible portion of interest, capped at $750K of principal under IRC Section 163(h)(3). Apply the buyer's marginal federal rate plus state rate (35% rather than 37% federal in the top bracket, after the 2026 Section 68 limit on itemized deductions), and count only the federal deduction above the standard deduction. For a $2.4M jumbo at 7.39% (the MBA average for the week of Oct 2, 2026) held by a 37% federal plus 9% state buyer, only 31.25% of the principal generates deductible interest. The after-tax rate is about 6.37% in year one for a buyer who already itemizes, or 6.72% if SALT at the $10,000 floor is their only other deduction, not the 3.99% a generic calculator implies by applying the full deduction. See the after-tax mortgage calculator spoke for the conversion mechanics.
- Does liquidating investments to buy in cash trigger a tax bill?
Yes, and the size of the bill depends on the cost basis of the liquidated lots. For a $1M sale at a 50% blended basis, the realized long-term gain is $500K. At a 20% federal LTCG rate plus 3.8% NIIT plus a 9% state rate (typical for a high-bracket California or New York buyer), the combined tax is roughly $164K, or 16.4% of the cash raised. That drag is real money and must be added to the cash-purchase column when comparing against a mortgage path.
- What discount rate should I use to compare cash vs mortgage?
Use the expected after-tax return on the alternative investment, not the risk-free rate. A buyer who would deploy the saved cash into a diversified 70/30 portfolio with an expected 7-8% nominal return uses roughly 6.0-6.5% after-tax as the comparison rate. A buyer who would park the cash in Treasury bills earning a hypothetical 4.5% nominal uses roughly 2.8% after-tax (Treasury interest is exempt from state tax). At a 7.39% jumbo, the first case is close to break-even (about 6.54% in Stockstead's 10-year model), and in the second the mortgage loses clearly. The opportunity-cost question is fundamentally about which alternative the cash actually funds.
- How does an SBLOC change the cash vs mortgage decision?
An SBLOC opens a third path: keep the cash invested, take a smaller jumbo, and fund the gap from a portfolio-secured line that does not trigger a liquidation. Under the right conditions, the SBLOC eliminates the cap-gains drag of the cash-purchase path while keeping the deductible portion of the jumbo. The math is non-trivial because SBLOC interest is generally non-deductible. See the SBLOC mortgage calculator at /blog/sbloc-mortgage-calculator for the full three-way comparison.
- What hold horizon makes the mortgage path most attractive?
A longer hold magnifies whichever way the spread runs; it does not favor the mortgage on its own. At a 7.39% jumbo and a 6.5% after-tax return, a buyer who already itemizes is about $9K behind after five years and about $36K ahead after twenty. A SALT-only itemizer at the same return is about $57K behind after five years and about $291K behind after twenty. When the spread is positive, a longer hold helps the mortgage path; when it is negative, a longer hold makes it worse. Below a 5-year hold, the closing costs and origination fees on the jumbo can outweigh any opportunity-cost gain, especially if the buyer expects to refi or sell.
Ready to run the numbers on your situation?
Open the calculator →Related posts
Pledged Asset Line (PAL) Mortgage Calculator: Schwab Rates
PAL mortgage calculator: Schwab's tiered SOFR spread schedule, relationship pricing discounts, maintenance LTV math, and a worked $1M draw vs a generic SBLOC.
After-Tax Mortgage Calculator: True Net Cost of Your Payment
After-tax mortgage calculator for HNW buyers: the $750K cap, the 2026 SALT phase-down, and a 7.39% jumbo that prices to about 6.4% after tax, not 3.99%.
High Net Worth Home Buyer Financing: The Complete Guide
Cash, jumbo mortgage, SBLOC, hybrid, and asset-depletion — the five paths to fund an HNW home purchase. After-tax math, decision framework, and links to deeper guides.