SBLOC vs Mortgage vs Cash: The Complete HNW Guide
By Tyler Singletary · · Updated · in Decision frameworks
You've decided on the house. You've decided on the mortgage. The question that's left — the one nobody's calculator actually answers — is where the down payment comes from.
A standard online mortgage calculator silently assumes the answer is "your savings account." It asks for the down payment as a number and moves on. For a buyer whose net worth is genuinely substantial but whose cash balance is more modest, that assumption hides the real decision. You can have $3.5M in net worth and still not have $300K liquid. The down payment has to come from somewhere, and the four somewheres — existing cash, liquidating stocks, a securities-backed line of credit (SBLOC), or some custom mix — produce wildly different ten-year financial outcomes.
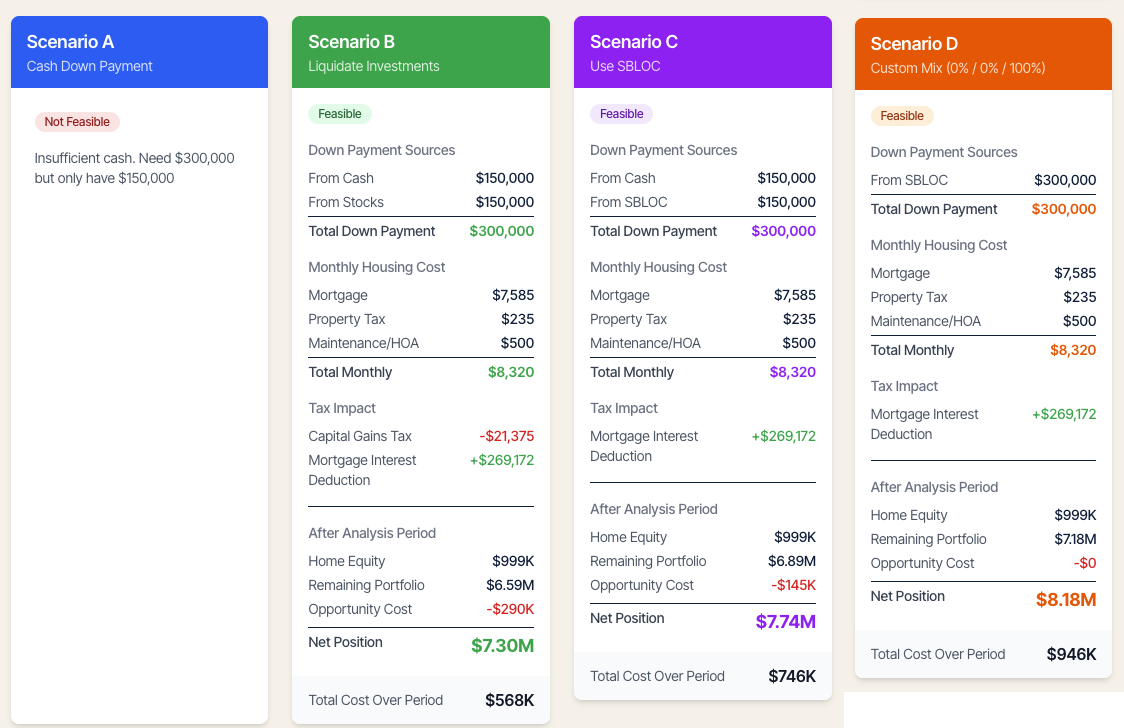
This post walks the four scenarios end-to-end against a single example: a $1.5M home, a 20% down payment, $150K cash, $2M in taxable stocks at 50% cost basis, 7% expected return, ten-year hold. The same example I'll use is the one running in the Stockstead calculator screenshot below — those are the numbers we'll work through.
The answer, before the unpacking
Same buyer, same house, same mortgage. Four ways to fund the $300K down payment.
| Scenario | How the $300K is sourced | Cap-gains tax | 10-yr cost | Net position at year 10 |
|---|---|---|---|---|
| A: Cash Down Payment | $300K from cash assets | — | — | Not feasible — only $150K cash exists |
| B: Liquidate Investments | $150K cash + $150K from stock sale | $21,375 | $568K | $7.30M |
| C: Use SBLOC | $150K cash + $150K SBLOC | $0 | $746K | $7.74M |
| D: Custom Mix (100% SBLOC) | $300K from SBLOC, no cash drained | $0 | $946K | $8.18M |
Two things stand out, and both are non-obvious:
Scenario A returns "Not Feasible." Most calculators would not catch this. The buyer has $3.65M in net worth across cash, stocks, and retirement — but only $150K of it is in a checking-style cash account, and a 20% down payment on a $1.5M home is $300K. The mortgage is approved. The home is in budget by every traditional metric. The buyer cannot actually close without doing something else, because the cash isn't there. Standard mortgage calculators will quietly let you proceed with a number you can't actually fund.
Scenarios B → C → D cost more, in that order — and end with more net wealth, in that order. The path that costs an extra $378K of carry over a decade (D vs B) leaves the buyer $880K wealthier at the end of the decade. The "expensive" choice is the wealth-maximizing choice in this scenario, by a wide margin. That's the part the standard mortgage calculator can't see at all.
The rest of this post is why.
Scenario A: pay the down payment from existing cash
In the calculator's framing, "Cash Down Payment" doesn't mean pay all-cash for the home — that's a different scenario for a different buyer. It means fund the 20% down payment from your existing cash & equivalents, while the rest of the purchase is mortgaged normally.
For most HNW buyers I see — and frankly, for the situation I was modeling for myself when I built Stockstead — Scenario A is the aspirational path. Pay the down payment from cash you already have, take a normal mortgage on the rest, never realize a capital gain, never carry a leverage line. Clean and simple.
It's also the path that quietly fails for a meaningful share of buyers. Tech compensation packages produce a specific shape: a lot of net worth in equity and retirement, a much smaller share in liquid cash. A buyer with $2M in a brokerage account and $1.5M in a 401(k) might still only have $150K of cash, because cash is what got spent on rent and groceries last year while everything else compounded. When that buyer goes to write a $300K check, the mortgage calculator says "great, here's your monthly payment." The bank says "we'll need proof of funds for the down payment." The cash account says "we have $150K."
Stockstead's response — Not Feasible. Need $300,000 but only have $150,000 — is the part the calc gets right that other tools don't. It tells you, before you've gotten attached to the house, that this version of the deal doesn't work and you need to pick from B, C, or D. That's a genuinely useful answer. "Insufficient cash" is a real constraint and pretending it isn't doesn't make it go away.
Scenario B: top up the cash with a stock liquidation
When the cash isn't enough, the obvious next move is to liquidate enough stock to cover the gap. In this example, that's $150K of stock sales to top up the $150K of cash — same $300K down payment, but now half of it came from a taxable brokerage account.
The tax bill, more modest than you'd expect. Selling $150K of stock at 50% cost basis realizes a $75K gain. At a combined LTCG rate of 28.5% (a 15% federal bracket plus a 13.5% state bracket — typical for a high-state filer below the 20% federal threshold), that's a tax of $21,375. Not nothing, but a fraction of what it would be if the buyer had to fully liquidate.
This is the part that broke my mental model when I first ran the numbers. I'd been thinking about "liquidating stocks for a down payment" as a $300K liquidation event with a tax bill scaled to the full down payment. The calculator's reality is much friendlier: cash drains first, stocks fill the gap, and the tax bill scales to the gap, not to the down payment. A bigger cash account makes Scenario B materially cheaper.
Ten-year position. Mortgage interest paid (on the $1.2M loan at 6.5% over 10 years, with the deduction value of ~$269K netted out) plus the $21K cap-gains hit. The portfolio is now $1.85M to start (because $150K was sold), and it grows at 7% real for ten years to roughly $3.64M. Plus home equity of about $999K (after a decade of normal amortization). Net position: $7.30M. Total cost: $568K — the lowest of the three feasible scenarios.
This is the path that minimizes nominal cost. Which is not the same as maximizing wealth.
Scenario C: use an SBLOC for the gap, keep the stocks
Same setup, but instead of liquidating $150K of stock, the buyer opens a securities-backed line of credit and draws $150K from it. Cash still drains first ($150K). The stocks stay where they are, untouched, compounding.
The cost shape is different. No capital gain is realized — tax bill is $0. But the SBLOC carries interest at 8.5% on the $150K balance, accruing for the entire ten-year hold. With the calculator's default capitalize interest, keep outstanding settings — meaning the buyer pays interest into the loan rather than from outside cash flow — the line balance grows over time, and the opportunity cost against the buyer's expected portfolio return shows up as roughly $145K over the decade. (For the full mechanics of how SBLOC interest, LTV, and maintenance ratios actually work, see how an SBLOC actually works.)
Ten-year position. Same mortgage, same MID benefit, same home equity at year 10. The portfolio is now the full $2M to start (nothing was sold), compounding at 7% real for ten years to $3.93M. Net of the SBLOC balance, net position: $7.74M. Total cost: $746K.
So Scenario C costs $178K more than Scenario B over the decade, and leaves the buyer $440K wealthier at the end of it. The "expensive" choice is the better choice on net.
Scenario D: skip the cash, run the SBLOC for the entire down payment
The Custom Mix scenario lets you set any combination of cash, liquidation, and SBLOC. The version that's most interesting — and that most "compare-the-options" articles never model — is 0% cash, 0% liquidation, 100% SBLOC. Don't drain the cash. Don't sell anything. Borrow the entire $300K down payment from the SBLOC.
This sounds aggressive, and the nominal-cost number reflects that: SBLOC interest accrues on $300K instead of $150K, doubling the carry cost, and total ten-year cost climbs to $946K — roughly $200K more than Scenario C.
But: the cash account also keeps compounding now. The $150K that didn't get drained sits in a brokerage cash position (or a money-market fund) earning the buyer's expected return. The portfolio still keeps compounding (nothing was sold). And the entire net wealth picture shifts up.
Ten-year position. Net position: $8.18M. Total cost: $946K, but ending wealth is $440K higher than Scenario C and $880K higher than Scenario B.
This is the result that surprised me when I first saw it in my own modeling. The path with the highest total dollar cost is the path with the highest ending net worth. The interest paid on the SBLOC isn't free — it really is a real cost — but it's a smaller cost than the forgone returns on every dollar of cash and stock that didn't have to be spent. As long as the portfolio (and the held cash) outearns the borrowing rate, leverage compounds in your favor.
Why "lowest cost" and "highest wealth" aren't the same answer
Standard mortgage calculators rank options by total cost — the number you've paid out of pocket over the loan's life. By that metric, Scenario B (liquidate to fund the gap) wins decisively in this example.
But "total cost" doesn't account for what you still own at the end of the period. Scenario B ends with $7.30M of net wealth because the buyer sold $150K of stock and gave up a decade of compounding on it. Scenario D ends with $8.18M because nothing was sold and the cash that wasn't drained kept earning. The $378K extra cost of D vs B buys you $880K of additional net worth.
This is the calculation the Stockstead calculator does that nobody else's does. It tracks both the cost and the ending net wealth, separately, with the full compounding math on every dollar of cash, stock, and retirement assets across all four scenarios. The mortgage calculator that only tells you "monthly payment" is answering the wrong question for this buyer.
Where this analysis flips
The wealth-maximizing case for the SBLOC is strongest when expected portfolio returns are high, cost basis is low, and the buyer can carry the interest comfortably. Three scenarios where the ranking changes:
Low expected return. At 4% real instead of 7%, the SBLOC's 8.5% borrowing rate exceeds the portfolio's compounding rate. Scenarios C and D become worse than B on both cost and ending wealth. The leverage is a drag, not a multiplier. Run the numbers at conservative-return assumptions before committing.
High cost basis. If the buyer's stocks have a 90% cost basis (only 10% unrealized gain), the Scenario B tax bill drops to about $4,275 — a rounding error. The SBLOC's tax-avoidance value evaporates, and B starts to look more competitive on both cost and wealth.
Tight cash flow vs. existing debt. The example buyer has $500K of household income against $10,800/month of existing debt. That's manageable. A buyer at $300K income with $8K/month of existing payments has a much smaller margin to absorb SBLOC interest plus a new mortgage payment. The math may favor D; the lived reality may not.
A buyer in a no-state-tax jurisdiction. Florida or Texas filer, 15% federal LTCG only, no state. Combined effective rate on the gain in Scenario B drops to 15% — a $75K gain costs $11,250 in tax. The B-vs-C-vs-D ranking on net wealth still typically favors C or D, but the gap is smaller.
How I'm thinking about this for my own purchase
I should be transparent: I haven't bought a house yet. Stockstead exists because I was researching how to buy one — looking at the New York market with a portfolio shaped the way two decades of tech compensation tends to shape a portfolio — and discovered no calculator on the internet was modeling the questions that actually mattered. So this section is me, thinking out loud about the situation I've been working through for myself, not a victory-lap recap of a deal I closed.
The shape I keep coming back to is a portfolio that's heavy on equity from one or two employers. Some of it is RSUs that vested in years when my W-2 was already pushing the 23.8%-federal-LTCG-plus-state-plus-NIIT bracket. Some of it is ISOs that haven't been exercised yet because exercising them would trigger AMT in a year I don't want it. Some of it is post-IPO grants from companies whose stock I'd rather hold than sell into a soft market. Add in concentrated single-employer exposure, vesting cliffs ahead, and a 30-year horizon I don't want to dent — that's the buyer the standard mortgage calculator was never built for.
For that shape, the SBLOC isn't really a "leverage strategy." It's a way to fund a down payment without forcing a tax event in a year my income already dislikes me. The interest paid on the line isn't the real cost. The avoided gain realization is the real value — plus the option, later, of harvesting a portion of the gain in a year I deliberately engineer for it (a sabbatical year, a year my W-2 income drops, a year I take the line down before realizing). The portfolio that didn't shrink by $150K of long-term-gain harvest in 2026 is worth substantially more than the $145K of opportunity cost on the SBLOC carry through 2036, and that's before the compounding the un-sold positions still get to do.
What changed when I saw the Custom Mix numbers in my own model is that I realized the question wasn't "do I use an SBLOC or do I liquidate." It was "how much do I lean on the SBLOC, and which of my existing assets do I leave compounding the longest." The mortgage calculator that doesn't model this dial silently picks one for you — usually B, the path of least resistance — and you never see the version of the decision where you ended up wealthier.
Run the numbers, not the rule of thumb
Stockstead lets you adjust every input — your home price, your cash, your stocks, your cost basis, your bracket, your state, your expected return, your time horizon, the SBLOC rate quoted to you, and the percentage mix in Custom — and shows all four scenarios side-by-side, including the Not Feasible warning when the cash isn't there. The math runs in your browser. None of your numbers leave the page.
The calculator's first job is to tell you whether your plan is even executable. Its second job is to tell you which version of the executable plans leaves you wealthiest at the end of the hold. Most online tools don't answer either question for an HNW buyer. This one was built to.
Sources
- IRS Topic 409 — Capital Gains and Losses
- IRS — Net Investment Income Tax (NIIT)
- IRS Publication 936 — Home Mortgage Interest Deduction
- IRS Publication 550 — Investment Income and Expenses
- FINRA — Securities-Backed Lines of Credit (Investor Alert)
- SEC — Securities-Based Lending Investor Bulletin
- Robert Shiller — Long-run S&P 500 data
Educational, not financial advice. Tyler Singletary founded Stockstead while researching his own first home purchase. He's spent 20+ years in software product roles — currently as Product Specialist for AI/ML Startups at AWS, previously CPO/COO at Tagboard, and an executive at Klout (exited to Lithium in 2014) — and has been compensated in RSUs, ISOs, and post-IPO equity at high-growth tech companies for two decades. He is not a licensed financial advisor or CPA. Tax rules and rate environments change; talk to a fiduciary advisor and a tax professional before acting on the figures here.
Frequently asked questions
- Why does a Cash Down Payment scenario often return 'Not Feasible' for HNW buyers?
Because cash and net worth are different things. A typical HNW buyer can have $3.65M in net worth across cash, taxable stocks, and retirement accounts, yet only $150K is actually in a checking-style cash account. A 20% down payment on a $1.5M home is $300K — twice the available cash. The mortgage is approved, the home is in budget by every traditional metric, but the closing literally cannot happen without sourcing the gap elsewhere. Standard mortgage calculators silently assume you have the cash and let you proceed with a number you cannot fund.
- How can the most expensive financing path leave you with the most net wealth?
Because total cost and ending net worth are different metrics. In the worked example — $1.5M home, $2M portfolio at 50% basis, 7% return, ten-year hold — liquidating stock to fund the gap costs $568K total and ends with $7.30M net wealth. Funding 100% from the SBLOC costs $946K total but ends with $8.18M net wealth. The extra $378K of carry cost buys $880K of additional ending wealth, because nothing was sold, the cash that was not drained kept earning, and the full portfolio kept compounding. Leverage compounds in your favor when the portfolio outearns the borrowing rate.
- When does the SBLOC scenario stop being the wealth-maximizing choice?
Three flips matter. Low expected portfolio return — at 4% real instead of 7%, the SBLOC's borrowing rate exceeds the compounding rate and the leverage becomes a drag, not a multiplier. High cost basis — if your stocks are recent contributions with a 90% basis, liquidating triggers a trivial tax bill (about $4,275 on a $150K gap sale) and the SBLOC's tax-avoidance advantage evaporates. Tight cash flow against existing debt — the SBLOC's interest cost has to be serviced from income, and a buyer with thin margin between income and obligations cannot absorb the carry comfortably.
- How does the tax bill scale when you liquidate stocks for a down payment?
It scales to the gap, not to the down payment. Most calculators assume the entire down payment comes from a stock sale, which produces a large tax bill in their projections. The reality is cleaner: cash drains first, stocks fill the gap, and the tax bill scales to the gap. In the worked example with $150K cash and a $300K down payment, only $150K of stock is sold. At a 50% cost basis, that realizes a $75K gain. At a combined 28.5% LTCG rate, the tax bill is $21,375 — not the $50K+ a fully-liquidate model would project.
- What's the difference between minimizing total cost and maximizing net wealth?
Total cost is what you paid out of pocket over the loan's life. Net wealth at the end of the period accounts for what you still own — the appreciated portfolio that was never sold, the cash that was never drained, the home equity built through amortization. Standard mortgage calculators only track total cost, which is why they default to recommending the path that minimizes payments. Stockstead tracks both, separately, with full compounding math on every dollar across all scenarios. The wealth-maximizing answer is frequently different from the cost-minimizing one.
Ready to run the numbers on your situation?
Open the calculator →Related posts
Schwab Pledged Asset Line for a Home Purchase: When It Wins, the Process, and the Rate Schedule
When a Schwab Pledged Asset Line beats a jumbo or IBKR margin for a home purchase: the application process, the two LTVs that govern safety, and a worked $1M example.
High Net Worth Home Buyer Financing: The Complete Guide
Cash, jumbo mortgage, SBLOC, hybrid, and asset-depletion — the five paths to fund an HNW home purchase. After-tax math, decision framework, and links to deeper guides.
SBLOC vs HELOC for HNW Homeowners: An After-Tax Comparison
A Home Equity Line of Credit and a Securities-Backed Line of Credit sound similar but behave very differently — and for HNW homeowners, the after-tax math frequently reverses the headline rate gap. Here's the comparison, six variables, and three borrower profiles where the answer is obvious.